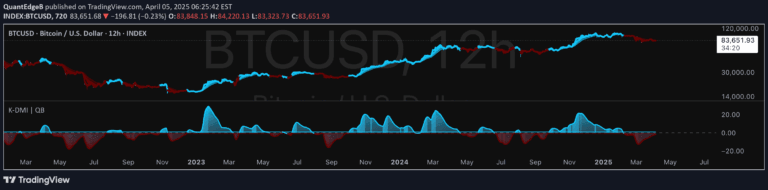
A normalized trend and momentum indicator using Double EMA and standard deviation that helps traders identify market trends, potential reversals, and adaptive momentum across different market conditions.
Explore complementary indicator rolesHow it works
The Normalized DEMA Oscillator SD calculates a Double EMA to create a smoother trend line with reduced market noise. It then normalizes this line using a two-standard deviation calculation, creating a bounded oscillator ranging from 0-100. The indicator processes price data through a smoothing mechanism, applying standard deviation to standardize momentum.
By mapping price movements against adaptive volatility bands, it generates a standardized signal that reveals trend strength and potential entry/exit points. The calculation transforms raw price data into a structured, comparable format across different assets and market conditions
Why it may be useful
This indicator provides traders with a sophisticated tool for understanding market dynamics by normalizing momentum across different assets. It reduces false signals common in choppy markets by using DEMA smoothing and standard deviation techniques.
Traders gain clearer insights into trend strength, potential reversals, and market conditions through a standardized oscillator. The approach allows for more consistent signal interpretation regardless of asset volatility. By presenting momentum in a structured 0-100 range, it simplifies complex market analysis and supports more informed trading decisions
When to explore it
The Normalized DEMA Oscillator SD works best in trending and range-bound markets with moderate to high volatility. It is particularly effective for swing traders seeking mid-trend entries and mean reversion opportunities. Traders should use it when comparing momentum across different assets or timeframes.
It is most reliable when combined with other technical indicators to confirm signals. The indicator excels in markets with clear directional movements and when traders want to filter out market noise. It is less effective in extremely low-volatility or completely random market conditions
Keep exploring
What we’ve verified
Access, alerts and repainting behaviour have not been independently verified for this indicator. Check the creator’s current publication and settings.
General descriptions and classifications are recovered research. Verified details above identify the specific checks we have completed. Check the creator’s current publication for later changes.