
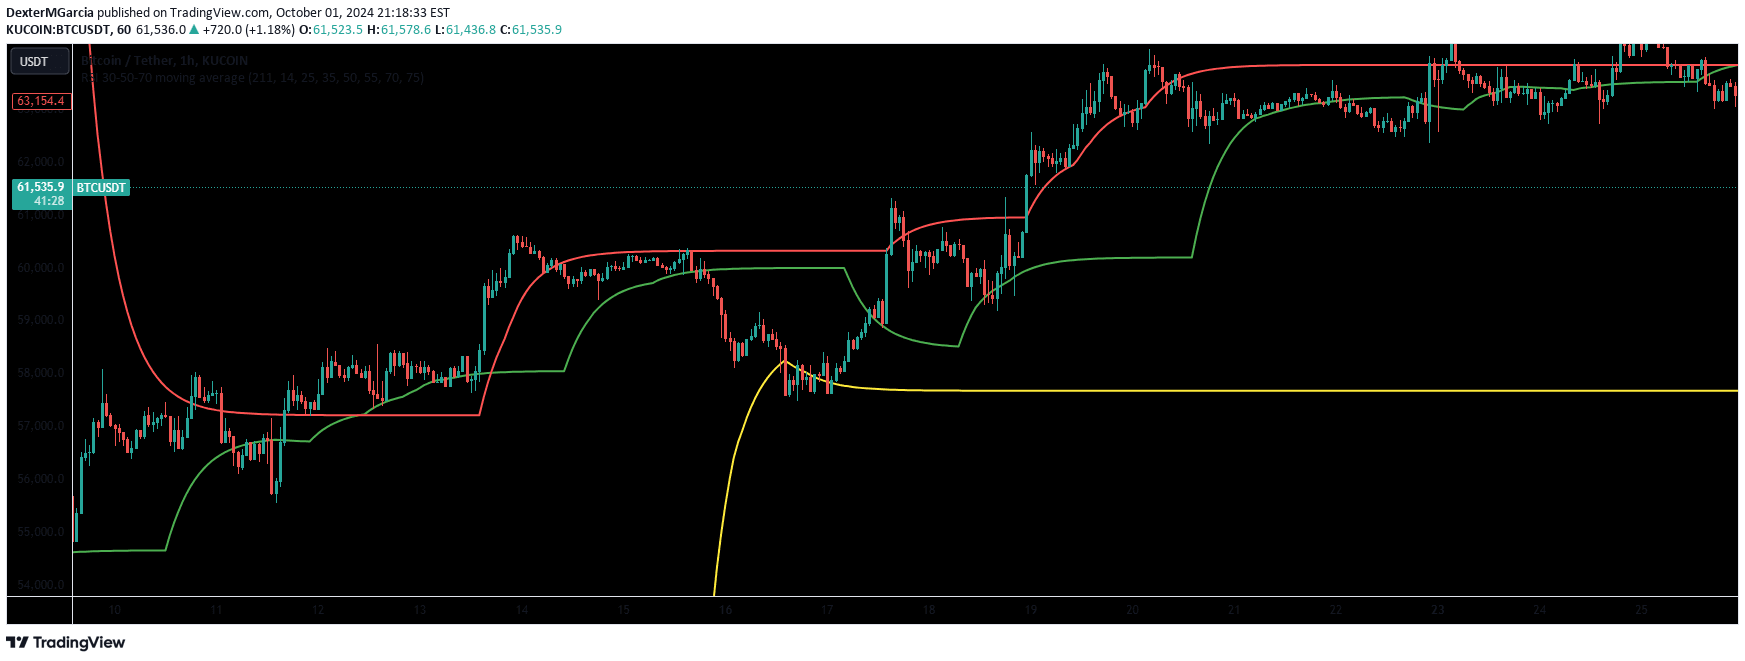
RSI 30-50-70 Moving Average indicator tracks price movements across three distinct RSI ranges, providing dynamic signals for potential trend reversals and market conditions.
Explore complementary indicator rolesHow it works
The RSI 30-50-70 Moving Average indicator calculates moving averages based on three specific RSI ranges: oversold (25-35%), neutral (45-55%), and overbought (65-75%). It plots three distinct moving average lines corresponding to these ranges, each representing different market conditions and potential trading signals.
Traders analyze these lines to identify potential entry and exit points by observing price movements relative to the RSI lines. When the price moves below the RSI_30 line and then closes above it, it signals a potential buy opportunity, while price closing above the RSI_70 line and then dropping below suggests a potential sell signal.
Why it may be useful
The RSI 30-50-70 Moving Average provides traders with a nuanced view of market momentum and potential trend reversals by integrating RSI levels with moving average analysis. This approach offers more sophisticated insights than traditional single-line indicators, allowing traders to better understand market dynamics and make more informed trading decisions.
By visualizing market strength across different RSI ranges, traders can identify potential oversold and overbought conditions more precisely. The indicator's flexibility in customizing RSI ranges and periods makes it adaptable to various market conditions and trading styles, enhancing overall strategic decision-making.
When to explore it
The RSI 30-50-70 Moving Average works best in short-term trading scenarios, particularly on 5- and 15-minute timeframes where momentum shifts are more readily observable. It is especially effective in markets with clear trending or oscillating characteristics, where RSI levels provide meaningful insights into potential price reversals.
Traders should prioritize using this indicator in markets with moderate volatility, where RSI ranges can more reliably signal trend changes. It is particularly useful for traders seeking a dynamic tool that combines trend-following and reversal signals, allowing for more nuanced market analysis across different asset classes.
Keep exploring
What we’ve verified
Access, alerts and repainting behaviour have not been independently verified for this indicator. Check the creator’s current publication and settings.
General descriptions and classifications are recovered research. Verified details above identify the specific checks we have completed. Check the creator’s current publication for later changes.


