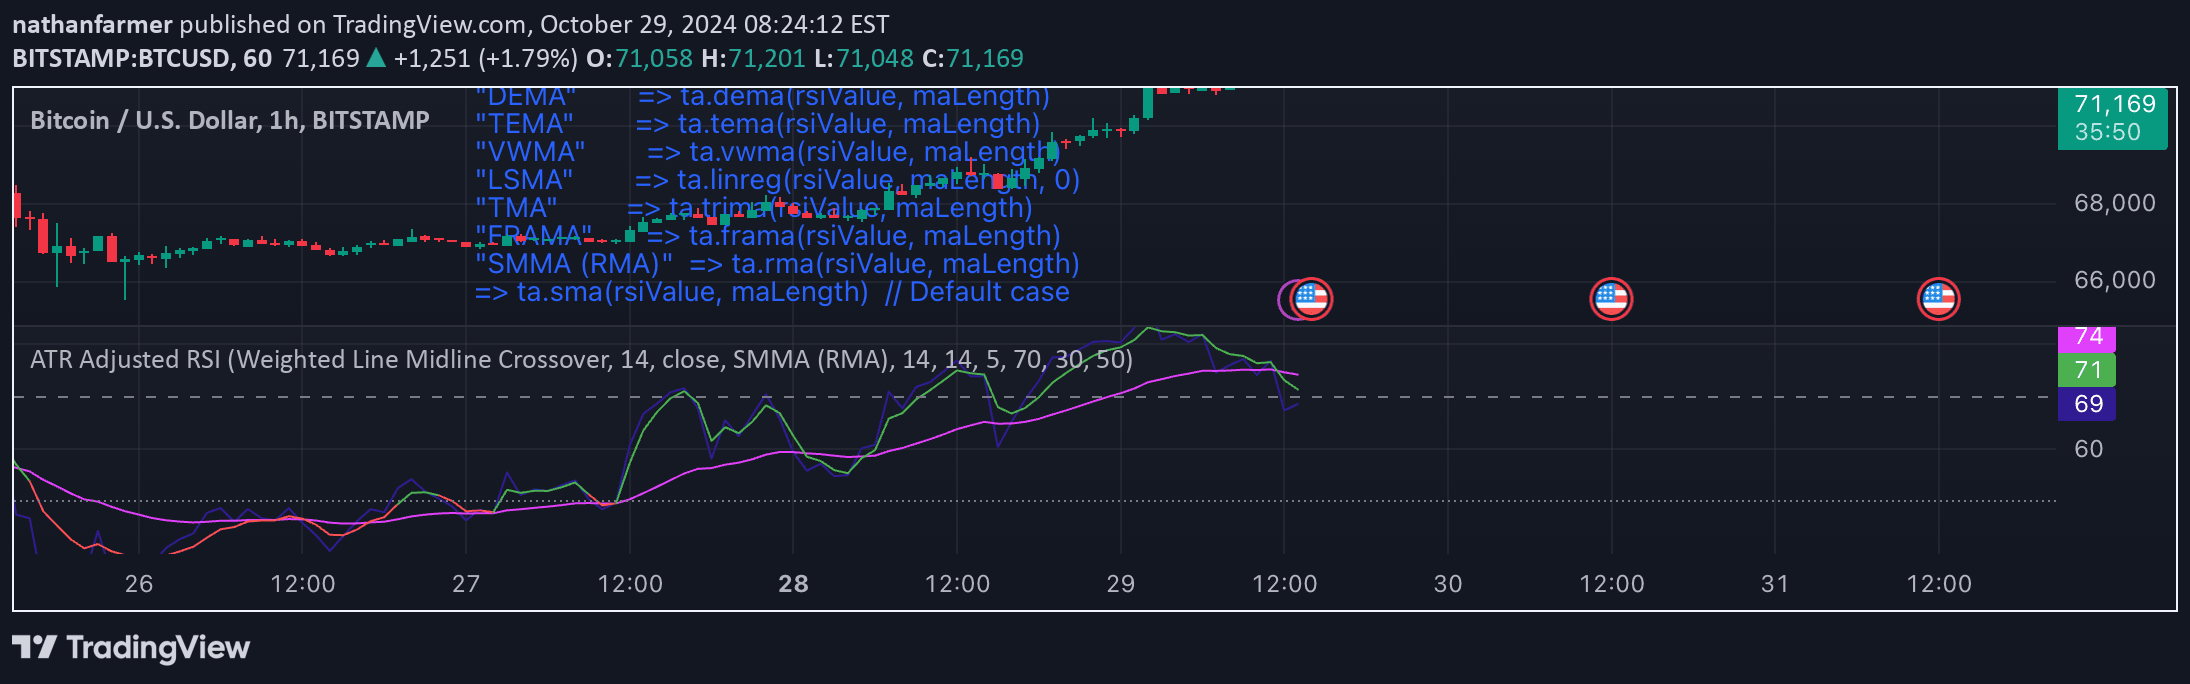
A dual-indicator strategy combining RSI's momentum and SMA's trend analysis to generate more reliable trading signals by filtering out market noise and confirming trend strength.
Explore complementary indicator rolesHow it works
The indicator integrates the Relative Strength Index (RSI) with a Simple Moving Average (SMA) to create a comprehensive trading signal. The RSI measures price momentum by tracking speed and change, oscillating between 0 and 100, with values above 50 indicating bullish momentum and below 50 signaling bearish conditions.
A 9-period Exponential Moving Average (EMA) is applied to the RSI to smooth out price fluctuations and provide clearer momentum insights. Simultaneously, the 9-period SMA tracks the average price to identify overall market trend direction, helping traders distinguish between upward, downward, and sideways market movements.
Why it may be useful
This combined approach offers traders a more robust method of analyzing market conditions by integrating both momentum and trend indicators. By blending the RSI EMA and SMA, traders can reduce the likelihood of false signals that often occur in choppy or range-bound markets, providing more confident trading decisions.
The dual-indicator strategy allows for more nuanced market analysis, capturing both short-term momentum shifts and longer-term trend directions. This comprehensive approach helps traders adapt to changing market conditions, offering a more reliable framework for timing entries and exits across different market phases.
When to explore it
The RSI and SMA combination works best in markets with clear directional trends and moderate volatility. Traders should apply this strategy when seeking to confirm trend strength and momentum before entering or exiting positions, particularly in day trading and swing trading scenarios.
Ideal usage includes identifying potential trend reversals, confirming trend continuations, and avoiding trades during periods of market uncertainty. The indicator is most effective when combined with other technical analysis tools and fundamental market research to validate trading decisions.
Keep exploring
What we’ve verified
Access, alerts and repainting behaviour have not been independently verified for this indicator. Check the creator’s current publication and settings.
General descriptions and classifications are recovered research. Verified details above identify the specific checks we have completed. Check the creator’s current publication for later changes.