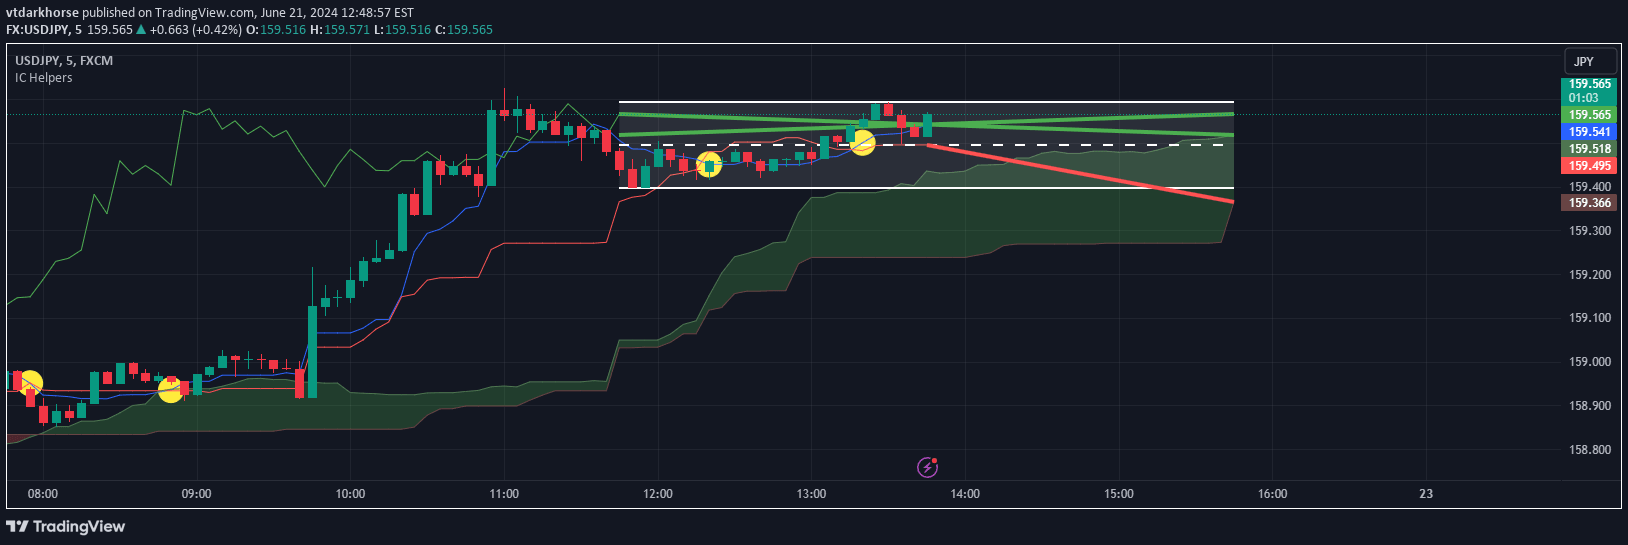
A comprehensive support and resistance indicator using Central Pivot Range and Lagging Span to identify key price levels and trading opportunities across multiple timeframes.
Explore complementary indicator rolesHow it works
The S&R Precision Cloud script calculates the Central Pivot Range (CPR) by averaging high, low, and close prices, creating a dynamic reference point for price action. It generates support (S1, S2, S3) and resistance (R1, R2, R3) levels across daily, weekly, and monthly timeframes, providing traders with multiple reference points for potential market movements.
Additionally, the script incorporates the Lagging Span from the Ichimoku Cloud, which is plotted as the closing price shifted backward by 26 periods. This component serves as a directional filter, helping traders identify potential trade entries by comparing current price position relative to the lagging line.
Why it may be useful
The indicator provides traders with a multi-dimensional view of market dynamics by combining pivot point analysis with the Lagging Span technique. It offers a comprehensive approach to understanding potential support and resistance levels, giving traders enhanced insights into possible price movements and trend directions.
By presenting levels across different timeframes, the script helps traders make more informed decisions, reducing emotional trading and providing a structured approach to identifying potential entry and exit points. The color-coded visualization makes it easier to quickly interpret market conditions and potential trading opportunities.
When to explore it
The S&R Precision Cloud is most effective in markets with clear trending characteristics, where support and resistance levels play a crucial role in price movement. It works exceptionally well in liquid markets with consistent price action, such as major forex pairs, stock indices, and prominent commodities.
Traders should utilize this indicator during periods of market volatility, particularly when price is approaching or bouncing off key pivot levels. It is particularly useful for traders seeking a systematic approach to identifying potential trade setups across multiple trading styles, from short-term scalping to longer-term swing trading strategies.
Keep exploring
What we’ve verified
Access, alerts and repainting behaviour have not been independently verified for this indicator. Check the creator’s current publication and settings.
General descriptions and classifications are recovered research. Verified details above identify the specific checks we have completed. Check the creator’s current publication for later changes.