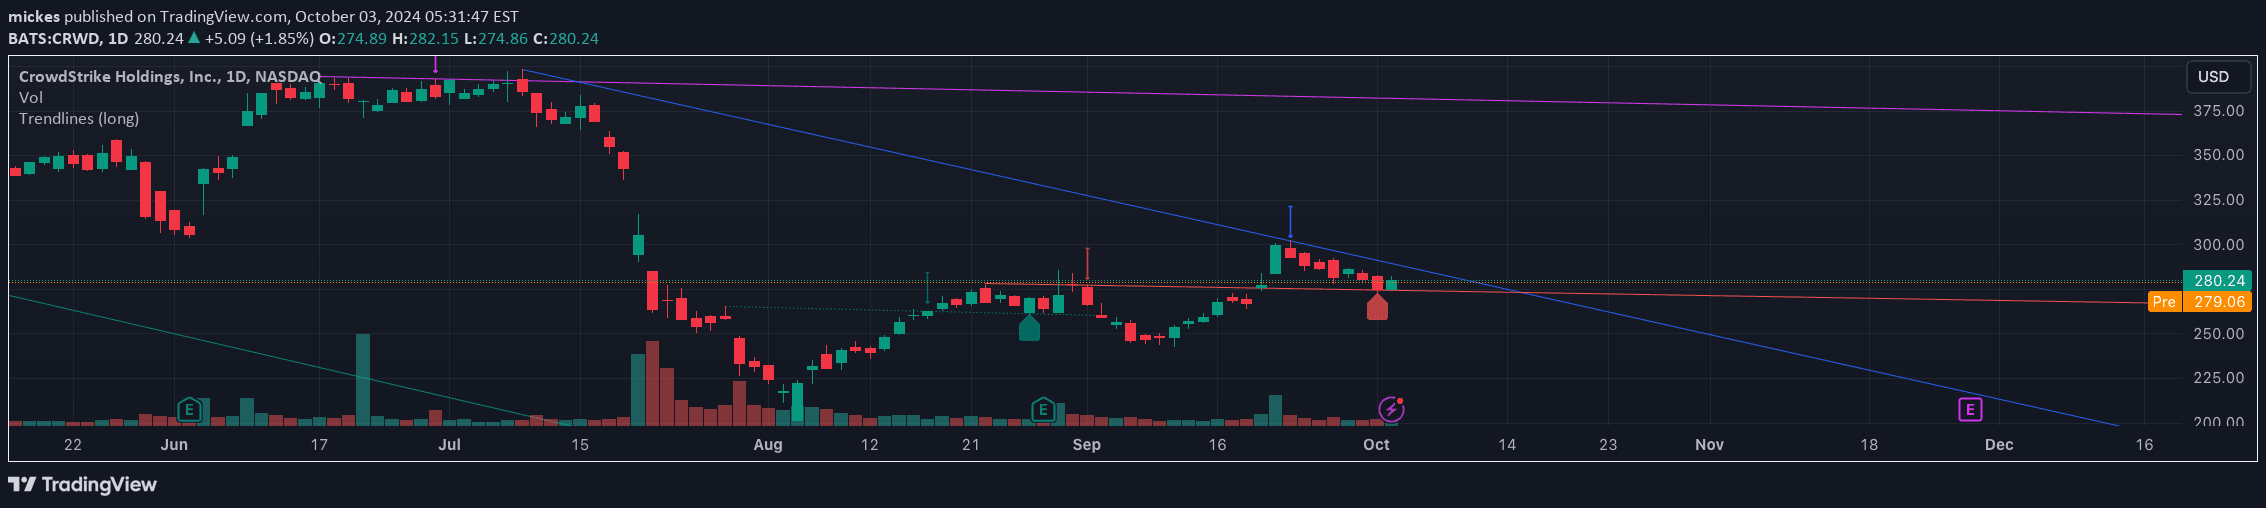
A dynamic linear regression trendline indicator that calculates the best-fit trend for closing prices over a customizable time window, helping traders identify market direction and potential support/resistance levels.
Explore complementary indicator rolesHow it works
The Rolling Linear Regression Trendline uses statistical linear regression to analyze closing prices within a specified time window. It calculates the slope and intercept of a line that best represents the price movement during the selected period, creating a dynamic trend representation.
Traders can customize the calculation window by choosing either a fixed number of bars or a specific number of days. The indicator automatically adjusts the bar count based on the chart's timeframe, ensuring consistent and relevant trend analysis across different market conditions and trading sessions.
Why it may be useful
The Rolling Linear Regression Trendline provides traders with a mathematically rigorous approach to trend identification, offering insights beyond subjective visual trend analysis. By using statistical methods, it helps traders objectively assess market direction and potential trend strength, reducing emotional decision-making.
This indicator's flexibility allows traders to adapt their analysis to various trading styles and timeframes. By providing a dynamic trendline that can be customized, it enables more precise trend recognition and can serve as a valuable tool for identifying potential entry and exit points.
When to explore it
The Rolling Linear Regression Trendline is most effective in markets with clear directional movements, where prices exhibit a consistent trend over the chosen time window. It works particularly well in trending markets, helping traders confirm and follow established price directions across different asset classes and timeframes.
Traders should consider using this indicator in conjunction with other technical analysis tools to validate trend signals and reduce false positives. It is especially useful when combined with momentum indicators or volume analysis to provide a more comprehensive market assessment.
Keep exploring
What we’ve verified
Access, alerts and repainting behaviour have not been independently verified for this indicator. Check the creator’s current publication and settings.
General descriptions and classifications are recovered research. Verified details above identify the specific checks we have completed. Check the creator’s current publication for later changes.