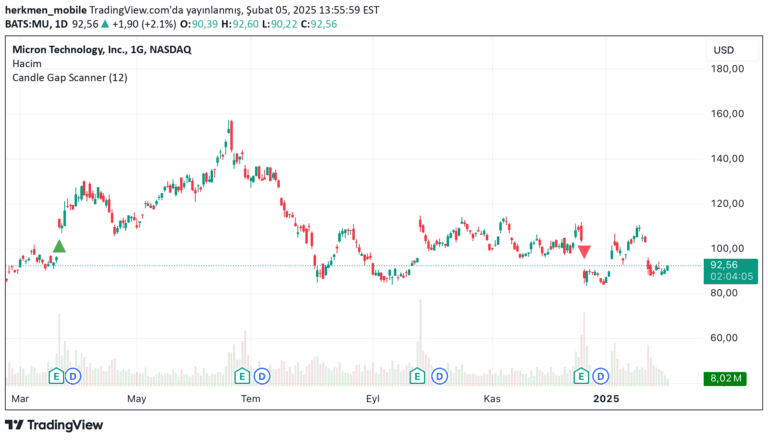
A specialized gap detection indicator that identifies price differences between selected days and weeks, helping traders spot potential trend reversals and market inefficiencies.
Explore complementary indicator rolesHow it works
The Sadosi Gap Selecter works by analyzing price movements between specific days and weeks chosen by the trader. Users can select a Start Day (day1) and End Day (day2), allowing them to focus on precise timeframes like Friday to Monday price changes.
The indicator automatically generates visual boxes representing price gaps within the selected date range. It determines the upper and lower bounds of these boxes based on price movement, highlighting areas of potential market significance and trend dynamics.
Why it may be useful
The indicator provides traders with a unique visual tool to identify market inefficiencies and potential trend reversals by highlighting price gaps. By offering customizable date ranges and visual settings, it allows traders to focus on specific time periods and market behaviors that might otherwise go unnoticed.
Its flexibility in color, transparency, and border settings enables traders to adapt the visualization to their personal trading style, making complex price movement analysis more accessible and intuitive.
When to explore it
The Sadosi Gap Selecter is most effective when used on daily charts to analyze short to medium-term price movements. It works best for traders seeking to understand price behavior between specific days of the week and within targeted weekly ranges.
Traders should utilize this indicator alongside other technical analysis tools to confirm signals and make more informed trading decisions. It is particularly valuable for those interested in gap trading strategies and identifying potential market turning points.
Keep exploring
What we’ve verified
Access, alerts and repainting behaviour have not been independently verified for this indicator. Check the creator’s current publication and settings.
General descriptions and classifications are recovered research. Verified details above identify the specific checks we have completed. Check the creator’s current publication for later changes.