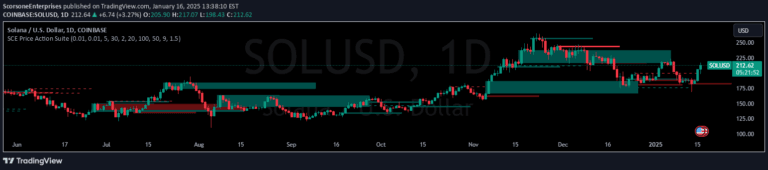
A technical indicator for tracking new price highs and lows in uptrends and downtrends by counting bullish and bearish candles that update previous price extremes.
Explore complementary indicator rolesHow it works
The Sakata New Price indicator tracks price movement by identifying and counting candles that establish new highs or lows during trending markets. For uptrends, it counts the first bullish candle as the starting point and subsequently tracks bullish candles that close higher than previous highs.
In downtrends, it identifies the first bearish candle and then counts bearish candles that close lower than previous lows. Traders manually set the starting point by clicking on the chart, which initializes the counting mechanism. The indicator then visually labels new high candles in red and new low candles in blue, providing a clear visual representation of price progression and trend development.
Why it may be useful
The Sakata New Price indicator helps traders understand trend dynamics by systematically tracking price progression and identifying significant price movements. By highlighting candles that establish new highs or lows, it provides insight into the strength and momentum of a developing trend, allowing traders to make more informed decisions about potential entry and exit points.
This method of tracking price action can reveal subtle changes in market sentiment and trend strength that might not be immediately apparent through traditional price charts. The visual labeling of new highs and lows enables traders to quickly assess the market's directional bias and potential trend continuation or reversal signals.
When to explore it
The Sakata New Price indicator is most effective in markets with clear trending behavior, whether in bullish or bearish conditions. It works particularly well in markets that exhibit consistent directional movement, such as during strong economic trends, sector rotations, or when significant fundamental factors are driving price action.
Traders should consider using this indicator in timeframes that allow for meaningful trend identification, ranging from short-term intraday charts to longer-term swing trading perspectives. It is especially useful when combined with other trend confirmation tools like moving averages or momentum indicators to validate the signals and provide a more comprehensive market analysis.
Keep exploring
What we’ve verified
Access, alerts and repainting behaviour have not been independently verified for this indicator. Check the creator’s current publication and settings.
General descriptions and classifications are recovered research. Verified details above identify the specific checks we have completed. Check the creator’s current publication for later changes.