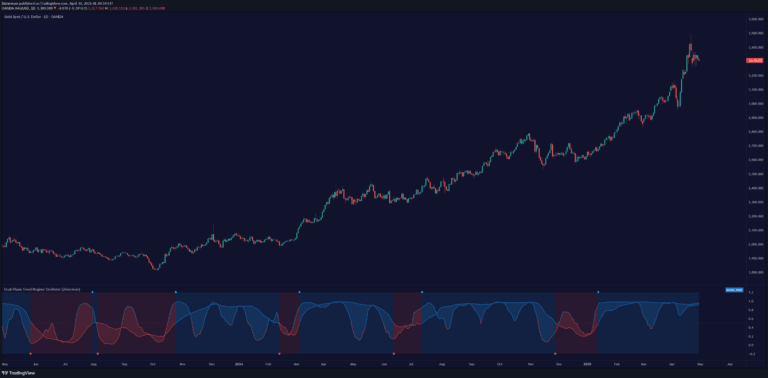
A dynamic market sentiment indicator that provides adaptive trend analysis by tracking price movements, offering color-coded insights into market momentum and potential trading opportunities.
Explore complementary indicator rolesHow it works
The Sentiment Range MA operates by creating a dynamic line that transitions between green and red based on market momentum. It calculates price averages using configurable parameters like length, ATR, and range multiplier to determine market sentiment.
When price remains within the chop zone, the indicator remains stable, filtering out market noise. Once price breaks outside this zone, the indicator rapidly recalibrates, changing color to signal potential trend shifts and providing traders with immediate visual cues about market direction.
Why it may be useful
The Sentiment Range MA offers traders a comprehensive view of market sentiment by translating complex price movements into easily interpretable visual signals. Its adaptive nature allows traders to quickly understand market trends without getting overwhelmed by intricate technical details.
By providing color-coded indications of bullish and bearish momentum, this indicator helps traders make more informed decisions about market entry and exit points. Its ability to dynamically adjust to changing market conditions makes it a versatile tool for traders across different timeframes and trading styles.
When to explore it
The Sentiment Range MA works best in markets with clear directional movements and during periods of significant price volatility. Traders can utilize this indicator most effectively when seeking to identify potential trend reversals or confirm existing market momentum.
It is particularly useful in markets like forex, stocks, and cryptocurrencies where rapid sentiment shifts occur. By adjusting its settings, traders can optimize the indicator for different market conditions, making it adaptable to various trading strategies and timeframes.
Keep exploring
What we’ve verified
Access, alerts and repainting behaviour have not been independently verified for this indicator. Check the creator’s current publication and settings.
General descriptions and classifications are recovered research. Verified details above identify the specific checks we have completed. Check the creator’s current publication for later changes.