
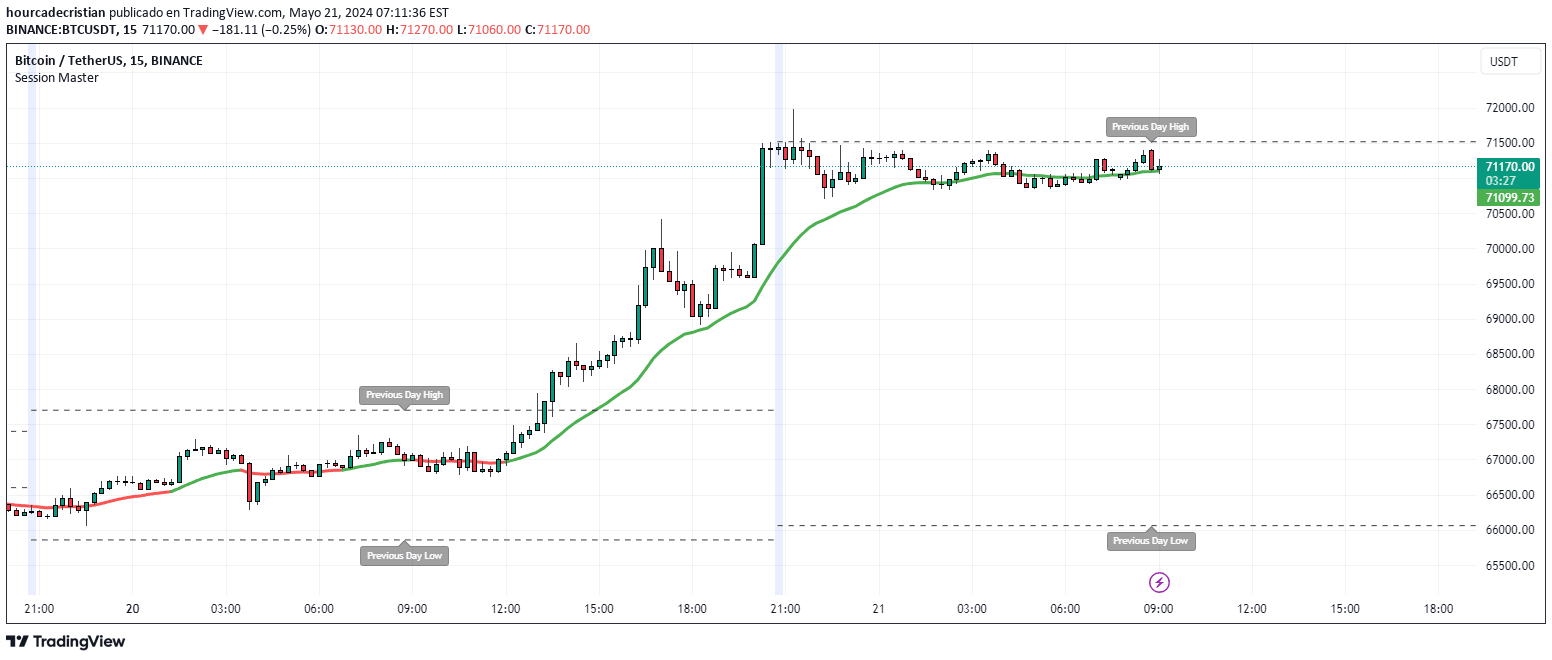
A trading indicator that highlights the last 15 minutes of a session, displaying previous session levels and analyzing market trend strength using ADX and DI indicators.
Explore complementary indicator rolesHow it works
The Session Master Indicator operates by first identifying the critical last 15 minutes of a trading session, marking this period with a semi-transparent blue background. It calculates the high and low points of the previous trading session and plots these as dashed reference lines to help traders recognize key support and resistance levels.
Simultaneously, the indicator computes trend strength using the Average Directional Index (ADX) and Directional Movement Index (DI). It analyzes directional movement over a 28-period window, smoothing True Range and Directional Movement values. A 21-period Exponential Moving Average (EMA) is then color-coded based on the DI difference, providing visual cues about the current market trend direction.
Why it may be useful
The Session Master Indicator provides traders with a comprehensive view of market dynamics during the most critical period of a trading session. By highlighting the last 15 minutes, it helps traders focus on potential end-of-day price movements and critical market transitions that can significantly impact trading decisions.
Moreover, the integrated trend analysis using ADX and DI offers traders deeper insights into market momentum and trend strength. The color-coded EMA and previous session level markers enable traders to make more informed decisions, reducing emotional trading and providing objective visual cues about market conditions.
When to explore it
This indicator is most effective for intraday traders who want to optimize their strategies around session closing times. It works particularly well in volatile markets where end-of-session movements can provide significant trading opportunities, such as stock indices, forex, and futures markets.
Traders should use the Session Master Indicator when they want to assess trend strength, identify potential support and resistance levels, and gain a quick visual understanding of market direction. It is especially useful during periods of market uncertainty, where the last 15 minutes of trading can often reveal critical market sentiment and potential trend reversals.
Keep exploring
What we’ve verified
Access, alerts and repainting behaviour have not been independently verified for this indicator. Check the creator’s current publication and settings.
General descriptions and classifications are recovered research. Verified details above identify the specific checks we have completed. Check the creator’s current publication for later changes.


