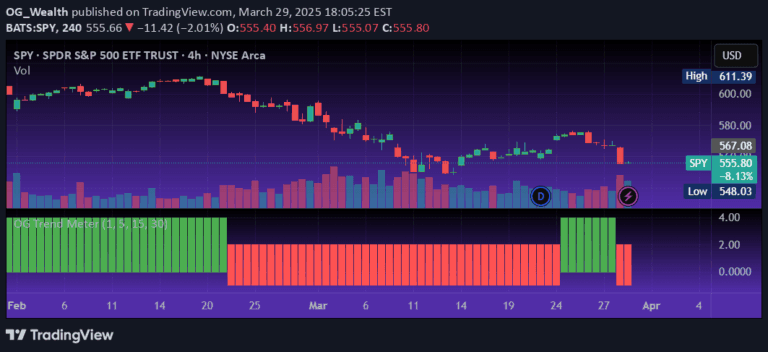
An adaptive EMA cloud indicator that dynamically adjusts EMA settings and support/resistance levels for day and swing trading strategies, helping traders identify trend direction and potential entry/exit points.
Explore complementary indicator rolesHow it works
The indicator uses three exponential moving averages (EMAs) to create two distinct clouds that visually represent market momentum. In day trading mode, it uses shorter EMA periods (5, 13, 21), while swing trading mode employs longer periods (12, 26, 50) to capture different market dynamics.
These EMA clouds change color based on trend direction, with turquoise and teal indicating an uptrend, and pink and magenta signaling a downtrend. The clouds help traders quickly understand market momentum by showing the relationship between fast, intermediate, and slow EMAs.
Why it may be useful
This indicator provides traders with a comprehensive view of market trends by combining EMA cloud analysis with adaptive support and resistance levels. By dynamically adjusting to different trading styles, it offers flexibility for traders who switch between day and swing trading strategies.
The visual representation of trend strength through color-coded clouds, combined with strategically placed support and resistance levels, allows traders to make more informed decisions about potential entry and exit points in various market conditions.
When to explore it
The EMA Cloud indicator is most effective in trending markets where clear directional movement can be identified. It works particularly well for traders who want a flexible tool that can adapt to both short-term and long-term trading strategies, providing insights across different timeframes.
Traders should use this indicator when they need a visual representation of market momentum and want to identify potential trend reversals. It is especially useful for those who trade across multiple timeframes and require a dynamic, adaptable analytical tool.
Keep exploring
What we’ve verified
Access, alerts and repainting behaviour have not been independently verified for this indicator. Check the creator’s current publication and settings.
General descriptions and classifications are recovered research. Verified details above identify the specific checks we have completed. Check the creator’s current publication for later changes.