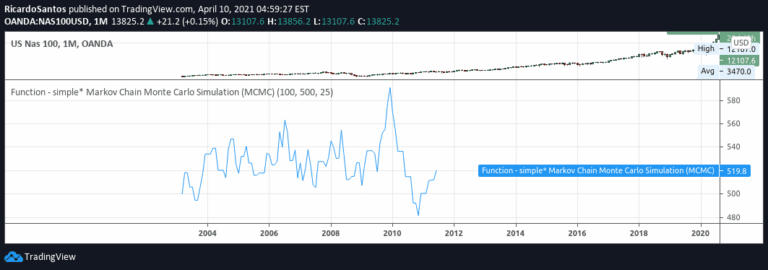
A Markov chain model that calculates transition probabilities between market price states, revealing potential price movement patterns based on recent historical performance.
Explore complementary indicator rolesHow it works
A Markov chain model tracks price transitions between different states, specifically analyzing up and down movements. The script calculates probabilities for four key transitions: up after up, down after down, up after down, and down after up, creating a statistical framework for understanding potential price behaviors.
By examining the entire accessible chart, the model generates transition probability percentages that reveal how likely certain price movements are based on recent market conditions. These probabilities help traders understand the current market's tendency to continue or reverse trends.
Why it may be useful
The Markov chain transition probability analysis provides traders with a mathematical approach to understanding market dynamics beyond traditional technical indicators. By quantifying the likelihood of specific price movements, traders can make more informed decisions about potential trend continuations or reversals.
This method offers a probabilistic perspective on market behavior, helping traders assess the statistical probability of different price scenarios. It transforms historical price data into actionable insights about potential future market movements.
When to explore it
The Markov chain transition probability model works best in markets with clear, identifiable trend patterns and sufficient historical data. It is particularly useful in relatively stable market conditions where recent price behaviors can provide meaningful predictive insights.
Traders should apply this analysis across different timeframes and financial instruments, comparing transition probabilities to identify markets with more predictable movement patterns. It is most effective when combined with other technical analysis tools to confirm potential trading signals.
Keep exploring
What we’ve verified
Access, alerts and repainting behaviour have not been independently verified for this indicator. Check the creator’s current publication and settings.
General descriptions and classifications are recovered research. Verified details above identify the specific checks we have completed. Check the creator’s current publication for later changes.