
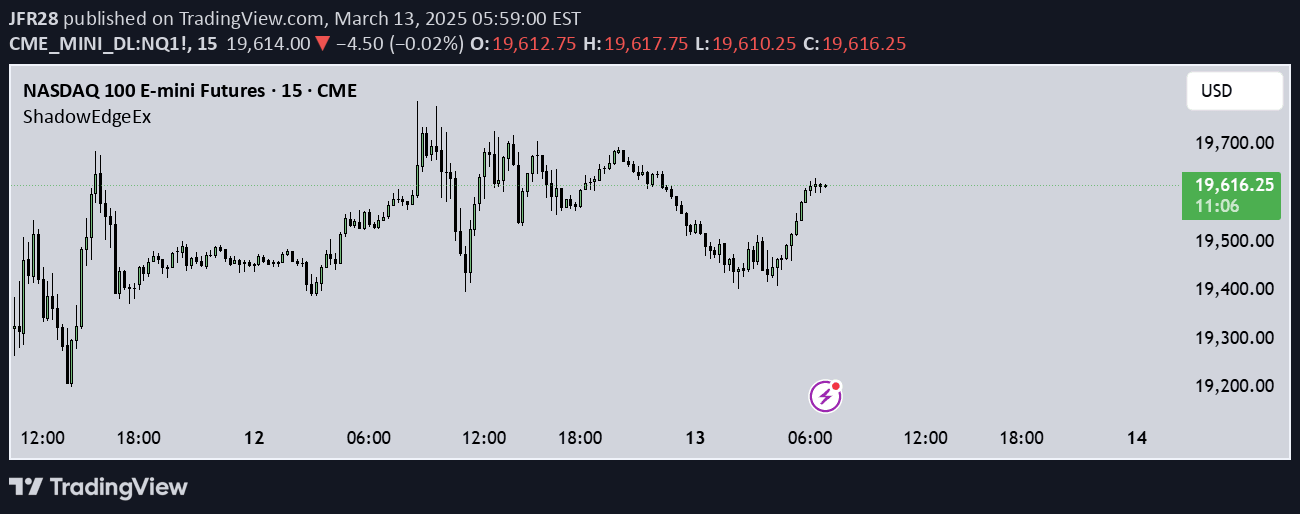
An hourly price tracking indicator that plots dynamic support and resistance levels, helping traders visualize intraday price boundaries and potential trading opportunities.
Explore complementary indicator rolesHow it works
The script continuously tracks hourly price extremes by detecting new hours and resetting high/low values. It captures and stores the previous hour's high, low, and midpoint levels as static reference lines on the chart.
During the current hour, the indicator dynamically updates the current hour's high and low levels using real-time price data. These levels are plotted as dashed lines, providing traders with a constantly evolving view of intraday price movement and potential support/resistance zones.
Why it may be useful
This indicator simplifies intraday price action analysis by providing a clear visual framework of hourly price dynamics. By displaying both static previous hour levels and dynamic current hour extremes, traders can quickly understand the current market context and identify potential trading opportunities.
The tool helps traders recognize key price boundaries, breakout potential, and mean-reversion setups. Its flexible customization options allow traders to adapt the indicator to their specific trading style and preferences.
When to explore it
The hourly price tracking indicator is most effective for intraday traders focusing on short-term price movements and seeking to understand immediate market dynamics. It works best in liquid markets with consistent hourly trading activity, such as forex, futures, and actively traded stocks.
Traders can use this tool to identify potential entry and exit points, recognize price consolidation zones, and gauge market sentiment within the current trading hour. It is particularly useful during volatile market conditions where quick decision-making is crucial.
Keep exploring
What we’ve verified
Access, alerts and repainting behaviour have not been independently verified for this indicator. Check the creator’s current publication and settings.
General descriptions and classifications are recovered research. Verified details above identify the specific checks we have completed. Check the creator’s current publication for later changes.


