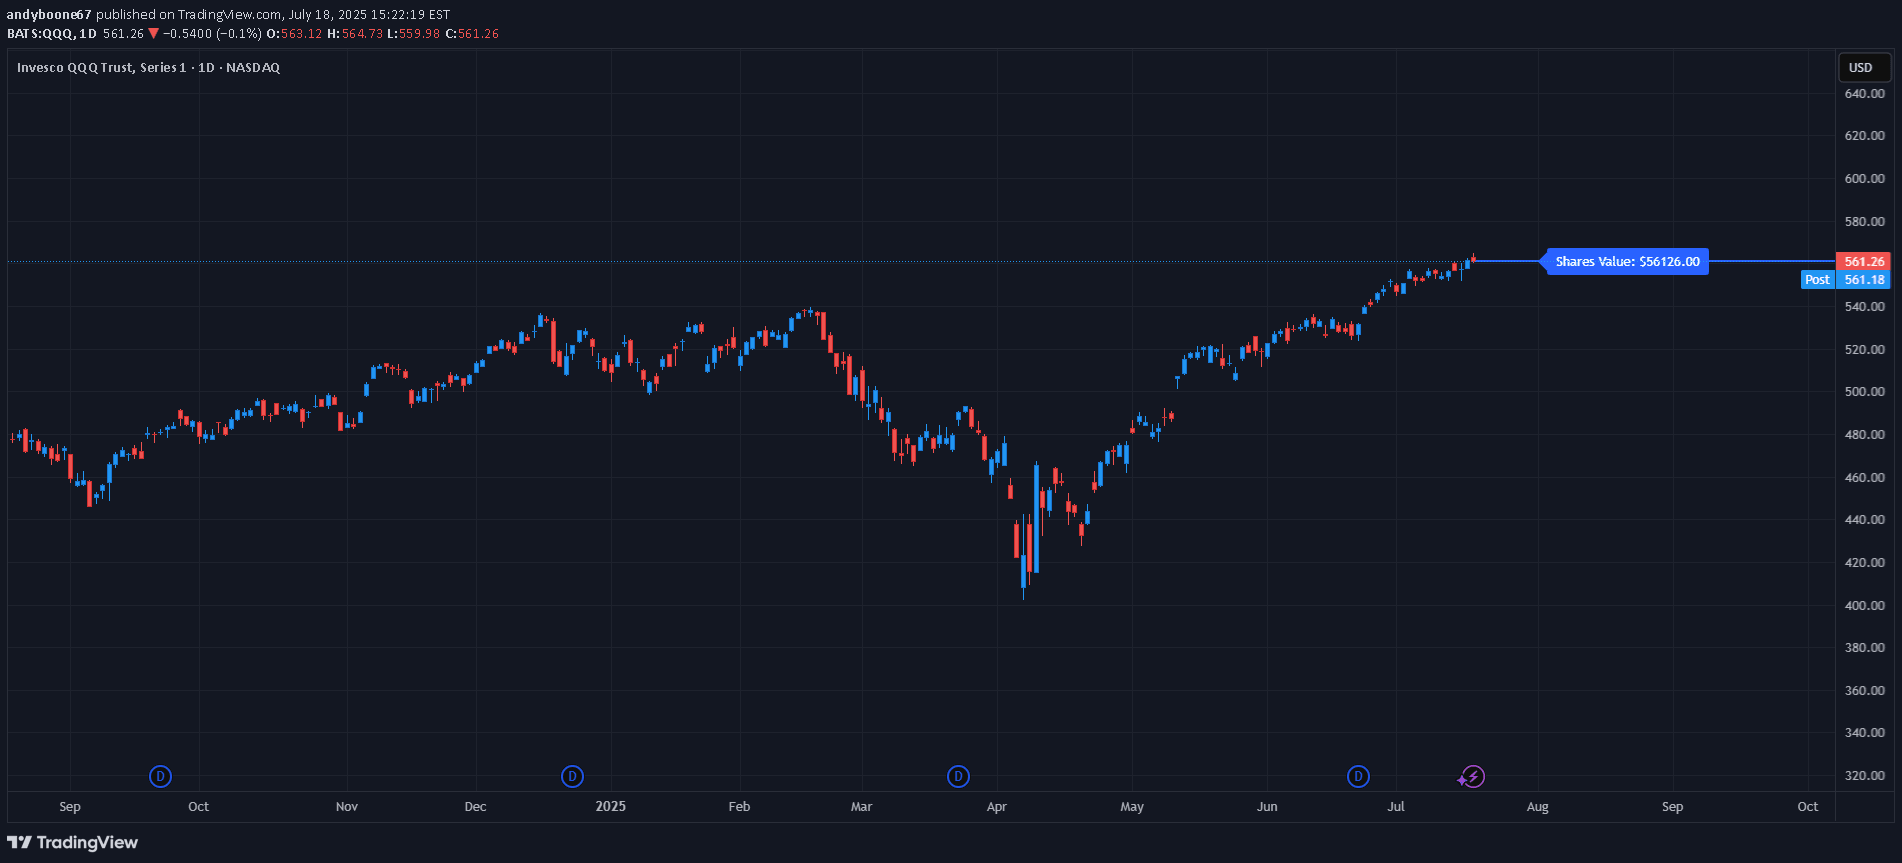
A TradingView indicator that calculates and visualizes the total value of stock holdings in real-time, displaying a horizontal ray and label showing current investment worth.
Explore complementary indicator rolesHow it works
The Share Value Indicator works by allowing traders to input the number of shares they currently own for a specific stock. Once the number is entered, the script dynamically calculates the total value by multiplying the current stock price with the number of shares.
The indicator automatically draws a horizontal ray at the last price level and displays a label showing the precise total value of the shares. As the stock price changes, the ray and label update in real-time, providing an instant snapshot of the investment's current worth. The script ensures only one ray and label are visible at a time, maintaining a clean and focused chart view
Why it may be useful
This indicator is crucial for traders and investors who want immediate visibility into their investment's performance. By providing a real-time calculation of total share value, it helps investors quickly assess their portfolio's current worth without manual calculations. The visual representation allows for instant understanding of investment changes, making it easier to track gains or losses.
Traders can use this tool to monitor their positions, make informed decisions about holding or selling, and maintain a clear perspective on their investment's status. The dynamic updating ensures accuracy and provides a psychological benefit of transparent, immediate financial information
When to explore it
The Share Value Indicator is most effective for active traders and investors who frequently monitor their stock positions. It is particularly useful during volatile market conditions where stock prices fluctuate rapidly. Swing traders and day traders will find this tool valuable for quick portfolio assessment and decision-making.
Investors holding multiple positions can use this indicator to track the real-time value of individual stocks or their entire portfolio. It is especially beneficial during earnings reports, market news events, or periods of significant market movement. The indicator helps maintain a disciplined approach to investment tracking and provides instant financial visibility
Keep exploring
What we’ve verified
Access, alerts and repainting behaviour have not been independently verified for this indicator. Check the creator’s current publication and settings.
General descriptions and classifications are recovered research. Verified details above identify the specific checks we have completed. Check the creator’s current publication for later changes.