
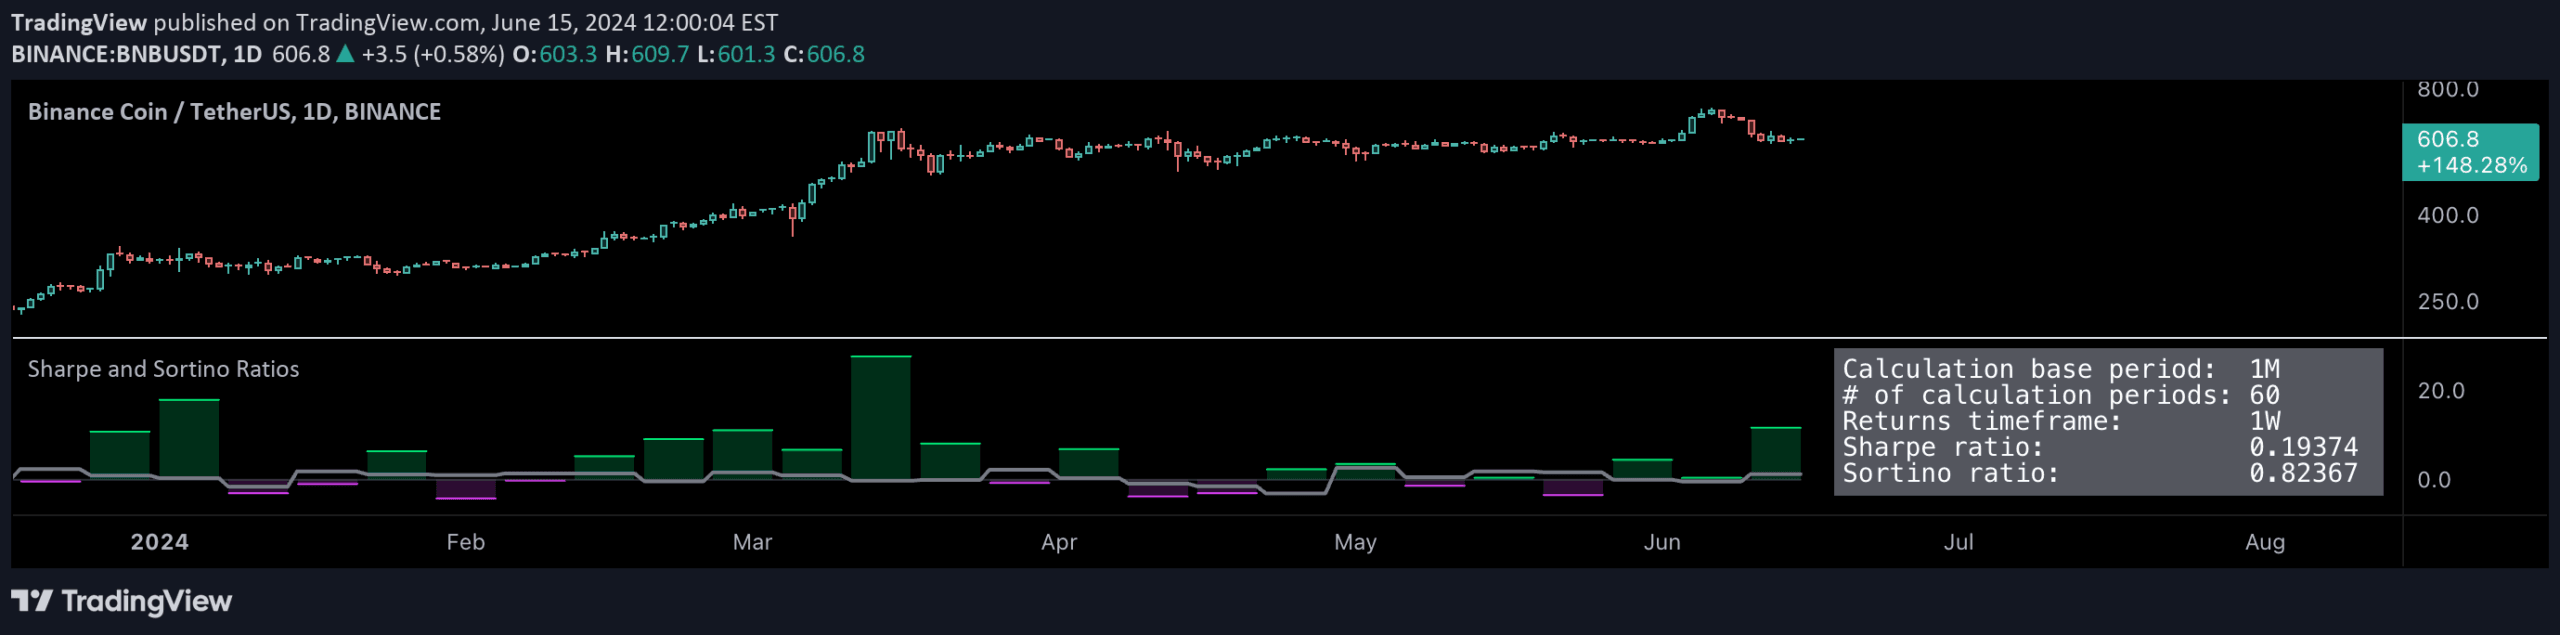
A comprehensive risk analysis tool that calculates Sharpe and Sortino ratios to evaluate investment performance relative to risk, helping traders assess the efficiency of their trading strategies.
Explore complementary indicator rolesHow it works
The indicator calculates risk-adjusted performance metrics by comparing periodic price returns against a risk-free rate or benchmark symbol. It tracks returns over monthly or daily periods, collecting data from up to 60 historical periods.
The Sharpe ratio measures total volatility, while the Sortino ratio focuses specifically on downside risk. The calculation involves comparing average investment returns to a theoretical risk-free rate and dividing by the standard deviation of returns
Why it may be useful
Risk-adjusted performance metrics provide crucial insights beyond simple returns by quantifying the quality of investment performance. They help traders understand how much risk is being taken to generate returns and whether the potential gains justify the associated volatility.
These ratios enable more informed decision-making by allowing comparison between different investment strategies or assets with varying risk profiles
When to explore it
This indicator is most effective when evaluating long-term investment strategies, comparing different trading approaches, or assessing portfolio performance. It works best with symbols that have consistent price data and sufficient historical information. Traders can use it to screen potential investments, validate trading strategies, and understand the risk-return trade-off
Keep exploring
What we’ve verified
Access, alerts and repainting behaviour have not been independently verified for this indicator. Check the creator’s current publication and settings.
General descriptions and classifications are recovered research. Verified details above identify the specific checks we have completed. Check the creator’s current publication for later changes.


