YOUR INDICATOR RESEARCH STARTS HERE

Find the right indicator.
Understand what it does.

Explore 11,183 indicators. Filter beyond the obvious.
Discover the tools that fit the way you trade.

THE INDICATOR LIBRARY

Results for “ratios”

11,183 tools to explore

277 indicators matching your filters
Save search
SignalLevelsPatterns

ICT Unicorn Model [LuxAlgo]

by LuxAlgo

A trading indicator that identifies unique price patterns using Fair Value Gaps and Breaker Blocks, highlighting potential entry and exit points with risk/reward targets.

Main price chart · unverifiedScalping · Day Trading
Explore
9.2Klikes207Kviews46comments
Save
LevelsSignalTrend

Fibonacci Ranges (Real-Time) [LuxAlgo]

by LuxAlgo

A Fibonacci-based indicator that creates dynamic trading channels and levels using swing highs and lows, helping traders identify potential support, resistance, and trend reversal points.

Main price chart · unverifiedScalping · Day Trading
Explore
5.9Klikes176.1Kviews25comments
Save
LevelsSignalTrend

Trending Market Toolkit [LuxAlgo]

by LuxAlgo

A trading toolkit focused on identifying market trends and reversals with flexible detection modes and risk management strategies for precise entry and exit points.

Main price chart · unverifiedScalping · Day Trading
Explore
5.9Klikes85Kviews13comments
Save
TrendMomentumEditor’s pick

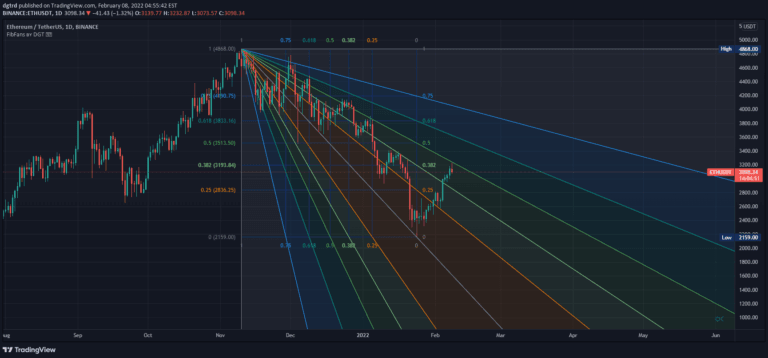
Auto Fib Speed Resistance Fans by DGT

by dgtrd

Fibonacci Speed and Resistance Fan is an analytical tool that identifies potential support and resistance levels by drawing lines based on Fibonacci percentages to predict trend changes and market movements.

Main price chart · unverifiedDay Trading · Swing Trading
Explore
5.8Klikes142.5Kviews133comments
Save
TrendMomentumEditor’s pick

Fibonacci Time-Price Zones

by xxattaxx

Fibonacci Time-Price Zones is an advanced indicator that combines Fibonacci ratios with time and price analysis, offering multiple geometric visualization methods to identify market turning points.

Main price chart · unverifiedDay Trading · Swing Trading
Explore
5.2Klikes147.5Kviews33comments
Save
TrendMomentumEditor’s pick

Multi ZigZag Harmonic Patterns

by Trendoscope

A comprehensive harmonic pattern recognition tool that identifies multiple chart patterns using zigzag indicators, helping traders detect potential trend reversals and continuation signals.

Main price chart · unverifiedDay Trading · Swing Trading
Explore
4.5Klikes134.5Kviews111comments
Save
TrendMomentumEditor’s pick

[JRL] MM Fibonacci

by JRL_6

A unique trading indicator combining Murrey Math formulas with Fibonacci retracement levels to identify potential market tops, bottoms, and long-term trend dynamics with enhanced precision.

Main price chart · unverifiedSwing Trading
Explore
4.4Klikes80.6Kviews60comments
Save
LevelsPatternsSignal

Three Drive Pattern Detector [LuxAlgo]

by LuxAlgo

A harmonic pattern detection indicator that identifies Three Drives patterns using multi-length swing detection and Fibonacci ratios to spot potential market reversals.

Main price chart · unverifiedScalping · Day Trading
Explore
4.3Klikes34.3Kviews13comments
Save
TrendMomentumEditor’s pick

Next Pivot Projection [Trendoscope]

by Trendoscope

A trading script that projects future pivot points by analyzing historical price patterns and calculating potential next pivot locations using statistical analysis of market movements.

Main price chart · unverifiedSwing Trading
Explore
4.1Klikes163.9Kviews136comments
Save
LevelsSignalVolume

Liquidations Zones [ChartPrime]

by ChartPrime

Identifies potential liquidation zones for leveraged positions by calculating percentage distances from pivots and tracking buy/sell volumes across different leverage levels.

Main price chart · unverifiedScalping · Day Trading
Explore
3.8Klikes59.8Kviews9comments
Save
LevelsSignal

Liquidity Grabs | Flux Charts

by fluxchart

A liquidity grab indicator that highlights market order execution points by rendering unique bubbles on candles where significant liquidity areas are swept with large wicks.

Main price chart · unverifiedScalping · Day Trading
Explore
3.5Klikes75.5Kviews9comments
Save

Likes, views, and comments are historical TradingView snapshots. They describe attention, not trading performance.

START WITH A QUESTION

A little less searching.
A lot more understanding.

Tell DeepAlpha what you need. Get an explanation, a shortlist,
and a direct path to the indicators behind it.

Ask DeepAlpha