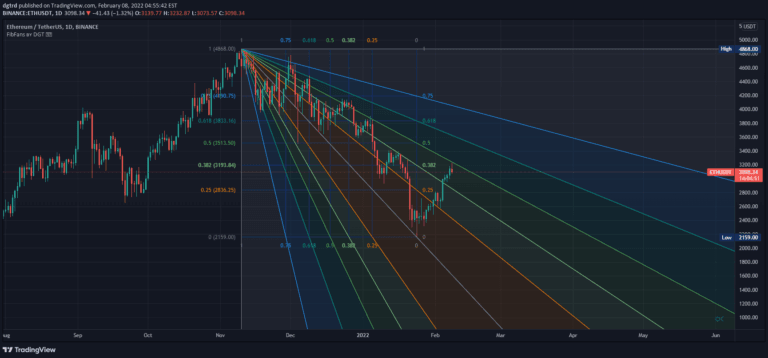
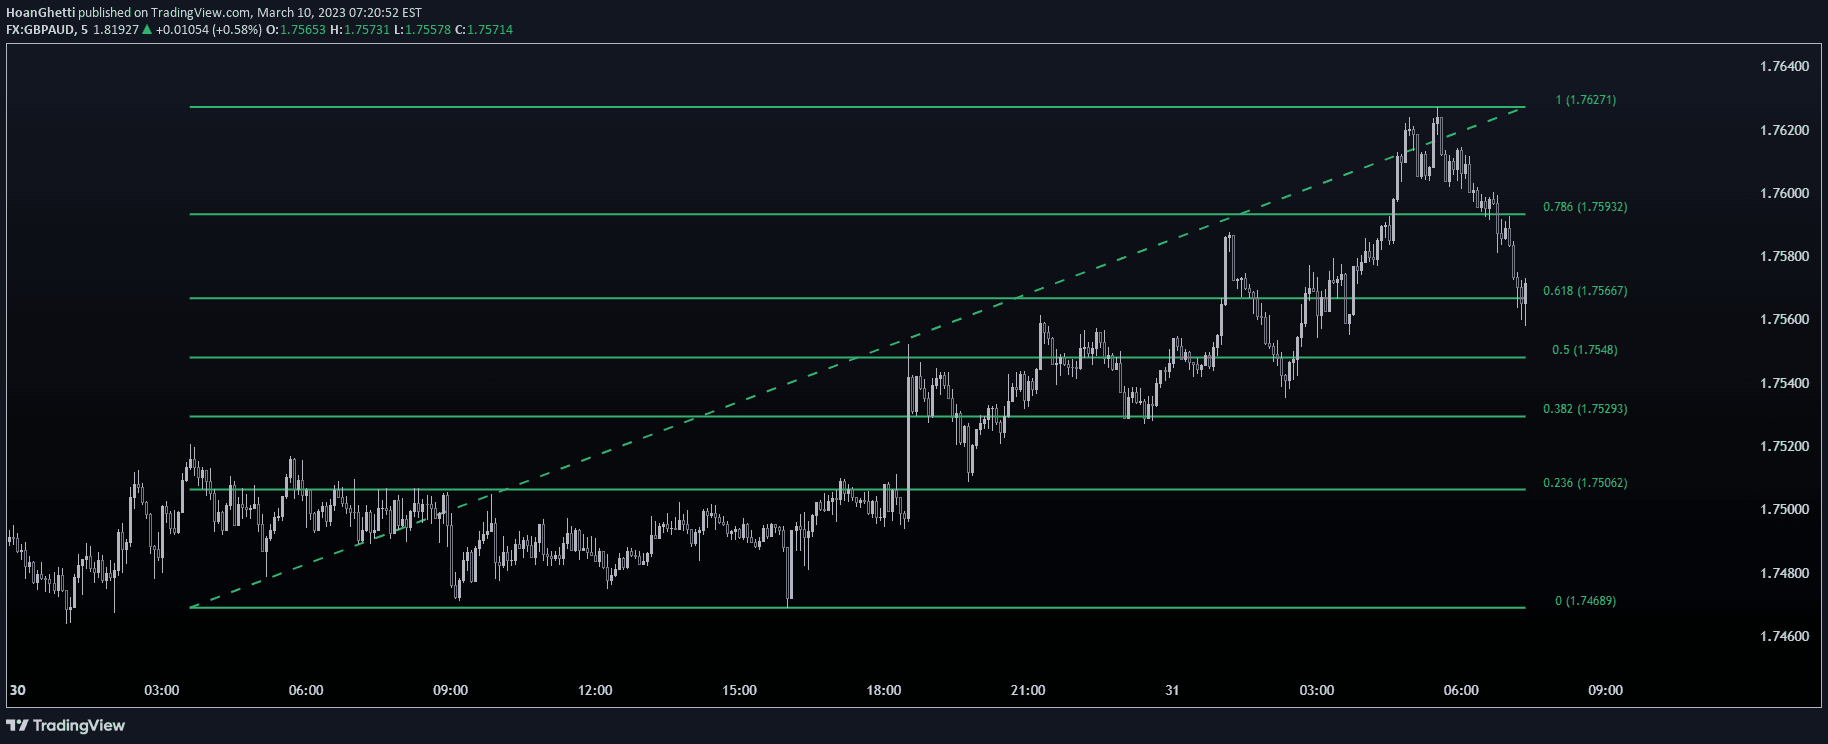
A unique trading indicator combining Murrey Math formulas with Fibonacci retracement levels to identify potential market tops, bottoms, and long-term trend dynamics with enhanced precision.
Explore complementary indicator rolesHow it works
This indicator first utilizes Murrey Math geometric formulas to precisely calculate potential market tops and bottoms. By identifying these key price levels, it then applies Fibonacci retracement ratios to create long-term trend analysis. The method starts by plotting strategic lines based on Murrey's mathematical principles, which provide a geometric framework for market movement.
Then, Fibonacci ratios are overlaid to refine the potential support and resistance levels. The combination allows traders to see not just geometric price patterns but also statistically significant retracement zones that might influence future price action
Why it may be useful
By integrating two powerful analytical approaches, this indicator offers traders a more comprehensive view of market dynamics. Murrey Math provides a structured geometric perspective on price movements, while Fibonacci retracements add statistical validation to potential trend reversals.
The hybrid approach reduces the likelihood of false signals by cross-referencing different analytical methods. Traders gain improved insight into potential trend continuation or reversal points, which can significantly enhance decision-making precision. This method bridges pure mathematical modeling with historical price behavior analysis
When to explore it
This indicator is most effective in markets with clear trending characteristics, particularly in swing trading scenarios. It performs best in financial instruments that exhibit consistent geometric price patterns, such as major currency pairs, blue-chip stocks, or prominent commodities.
Traders should apply it during periods of established market trends rather than during choppy, range-bound conditions. It's particularly useful when analyzing longer-term charts where geometric and Fibonacci patterns become more pronounced. The indicator provides maximum value when combined with other confirming technical analysis tools
Keep exploring
What we’ve verified
Access, alerts and repainting behaviour have not been independently verified for this indicator. Check the creator’s current publication and settings.
General descriptions and classifications are recovered research. Verified details above identify the specific checks we have completed. Check the creator’s current publication for later changes.