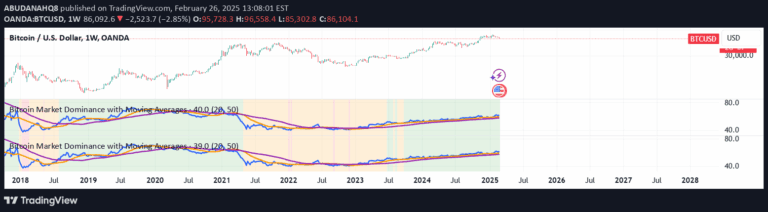
A customizable Exponential Moving Average (EMA) indicator that plots the primary EMA with upper and lower shifted lines to help identify dynamic support, resistance, and trend direction.
Explore complementary indicator rolesHow it works
The Shifted EMA calculates an Exponential Moving Average using a specified length, giving more weight to recent price data. It then creates two additional lines by shifting the primary EMA vertically up and down based on user-defined parameters.
These shifted lines act as dynamic support and resistance levels, providing traders with a flexible tool for analyzing price movement. By adjusting the EMA length and shift values, traders can customize the indicator to match different market conditions and trading strategies.
Why it may be useful
The Shifted EMA helps traders identify market trends and potential trading opportunities by providing a dynamic view of price movement relative to the moving average. It offers a more responsive analysis compared to traditional moving averages, allowing for more nuanced interpretation of market dynamics.
By visualizing potential support and resistance levels, traders can make more informed decisions about entry and exit points. The indicator's flexibility allows for adaptation to various market conditions, making it a valuable tool for understanding price behavior across different timeframes.
When to explore it
The Shifted EMA works best in trending markets where price movement shows clear directional momentum. It is particularly useful when traders want to identify potential trend reversals or confirm existing trend directions across multiple timeframes.
Traders should apply this indicator in markets with consistent price movement, such as forex, stocks, and cryptocurrencies. It is most effective when combined with other technical analysis tools to provide a more comprehensive market analysis and reduce the risk of false signals.
Keep exploring
What we’ve verified
Access, alerts and repainting behaviour have not been independently verified for this indicator. Check the creator’s current publication and settings.
General descriptions and classifications are recovered research. Verified details above identify the specific checks we have completed. Check the creator’s current publication for later changes.