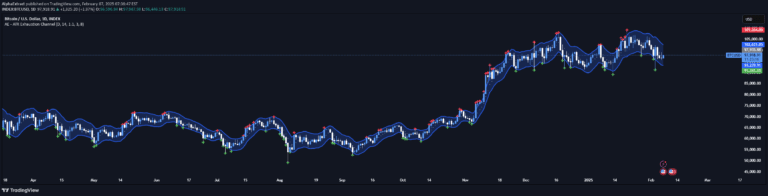
PlayBit EMA is a technical analysis tool using two Exponential Moving Averages to identify support, resistance zones, and potential market reversal points with dynamic color visualization.
Explore complementary indicator rolesHow it works
The PlayBit EMA operates by utilizing two Exponential Moving Averages (EMAs) that track price movements with varying sensitivities. These EMAs are calculated by giving more weight to recent price data, creating a more responsive indicator compared to simple moving averages. The indicator plots these EMAs on the price chart, allowing traders to observe their interaction and relationship with current market prices.
As the EMAs intersect or diverge, they generate visual signals about potential trend changes and market momentum. The dynamic fill color feature provides additional context, changing based on whether the closing price is above, below, or between the EMAs, which helps traders quickly interpret market conditions and potential trading opportunities.
Why it may be useful
The PlayBit EMA is crucial for traders seeking to understand market trends and potential reversal points with greater precision. By smoothing out price fluctuations and providing a clear visual representation of market dynamics, this indicator helps traders make more informed decisions about entry and exit points. The EMAs act as dynamic support and resistance levels, offering insights into potential trend strength and direction.
Moreover, the indicator's color-changing feature provides an intuitive, at-a-glance method for assessing market conditions. Traders can quickly determine whether prices are trending, consolidating, or potentially preparing to reverse, which is invaluable for developing strategic trading approaches across different market environments.
When to explore it
The PlayBit EMA is most effective in markets with clear trending characteristics, where price movements are more directional and less choppy. It performs exceptionally well in markets like cryptocurrency, forex, and stocks with sufficient liquidity and price momentum. Traders should ideally use this indicator in conjunction with other technical analysis tools to confirm signals and reduce false positives.
The indicator is particularly useful during periods of market transition, such as when prices are potentially changing from bullish to bearish or vice versa. By observing the interaction between the two EMAs and their relationship with current price action, traders can identify potential trend reversals and make more calculated trading decisions across various timeframes.
Keep exploring
What we’ve verified
Access, alerts and repainting behaviour have not been independently verified for this indicator. Check the creator’s current publication and settings.
General descriptions and classifications are recovered research. Verified details above identify the specific checks we have completed. Check the creator’s current publication for later changes.