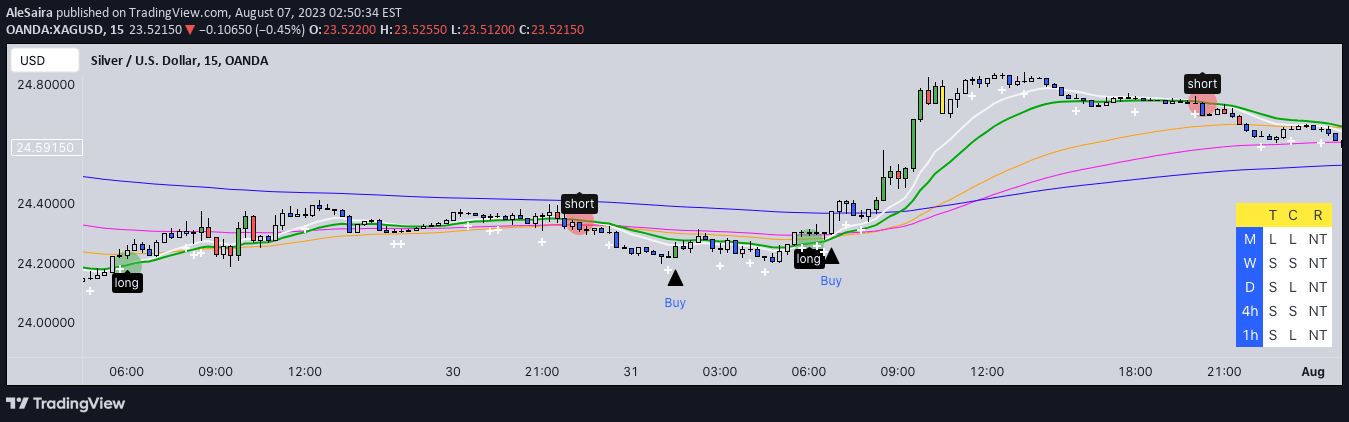
A multi-indicator trading signal that identifies market conditions: sideways, bullish, and bearish trends using RSI, ADX, and MACD for precise trading decisions.
Explore complementary indicator rolesHow it works
The trading signal uses three key technical indicators to analyze market conditions comprehensively. RSI measures momentum by tracking price movements and identifying overbought or oversold zones, while ADX determines trend strength through directional indicators DI+ and DI-.
MACD confirms trend direction by comparing moving averages, providing additional validation for the signal. When these indicators align, the system generates color-coded signals: purple for sideways markets, green for bullish trends, and red for bearish trends, offering traders clear visual cues about potential market movements.
Why it may be useful
This trading signal provides traders with a sophisticated, multi-layered approach to market analysis by combining momentum, trend strength, and directional indicators. By integrating RSI, ADX, and MACD, the signal offers a more robust and nuanced view of market conditions compared to single-indicator strategies.
The comprehensive approach reduces false signals and helps traders make more informed decisions across different market environments. Its color-coded system allows quick visual interpretation, enabling traders to rapidly assess market dynamics and potential trading opportunities with greater confidence and precision.
When to explore it
The trading signal is most effective in markets with clear trending or ranging conditions, making it valuable for various trading strategies. It performs exceptionally well in liquid markets with sufficient price movement, such as major stock indices, forex pairs, and actively traded commodities.
Traders should use this signal during periods of moderate to high market volatility, where trend identification and momentum confirmation are crucial. It is particularly useful for options strategies like strangles and straddles, as well as for making directional trading decisions in both short-term and medium-term timeframes.
Keep exploring
What we’ve verified
Access, alerts and repainting behaviour have not been independently verified for this indicator. Check the creator’s current publication and settings.
General descriptions and classifications are recovered research. Verified details above identify the specific checks we have completed. Check the creator’s current publication for later changes.