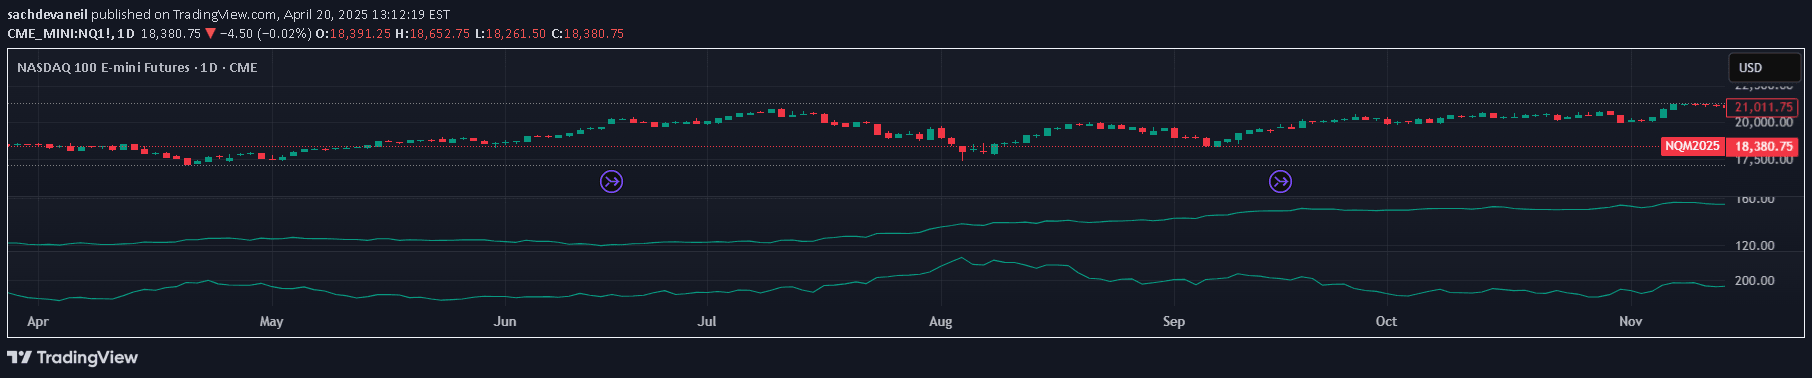
A volatility indicator that measures price movement deviation from historical average, helping traders identify unusual market conditions and potential extreme price scenarios.
Explore complementary indicator rolesHow it works
The Sigma Score calculates logarithmic returns between consecutive price values by first computing a simple moving average and standard deviation of these returns. It then determines the Sigma Score by measuring how far the current return deviates from the historical average in standard deviation units.
The calculation involves subtracting the average return from the current return and dividing this difference by the standard deviation. This process creates a standardized measure that quantifies how unusual or extreme a price movement is compared to its historical behavior.
Why it may be useful
The Sigma Score provides traders with a quantitative method to assess market volatility and identify potential anomalies in price movements. By translating price changes into standard deviation units, it offers a standardized approach to understanding market extremes that can be applied across different financial instruments and timeframes.
This indicator helps traders recognize potentially overbought or oversold conditions, offering insights into market sentiment and potential trend reversals. Its adaptability across multiple timeframes makes it a versatile tool for understanding price behavior and making more informed trading decisions.
When to explore it
The Sigma Score is most effective when markets are experiencing significant price fluctuations or when traders want to identify unusual market conditions. It works particularly well during periods of high volatility, helping traders spot potential trend reversals or extreme market movements.
Traders should use this indicator in conjunction with other technical analysis tools to confirm signals and reduce false positives. It is especially useful when analyzing different timeframes, from short-term minute charts to long-term monthly perspectives, providing a comprehensive view of price movement dynamics.
Keep exploring
What we’ve verified
Access, alerts and repainting behaviour have not been independently verified for this indicator. Check the creator’s current publication and settings.
General descriptions and classifications are recovered research. Verified details above identify the specific checks we have completed. Check the creator’s current publication for later changes.