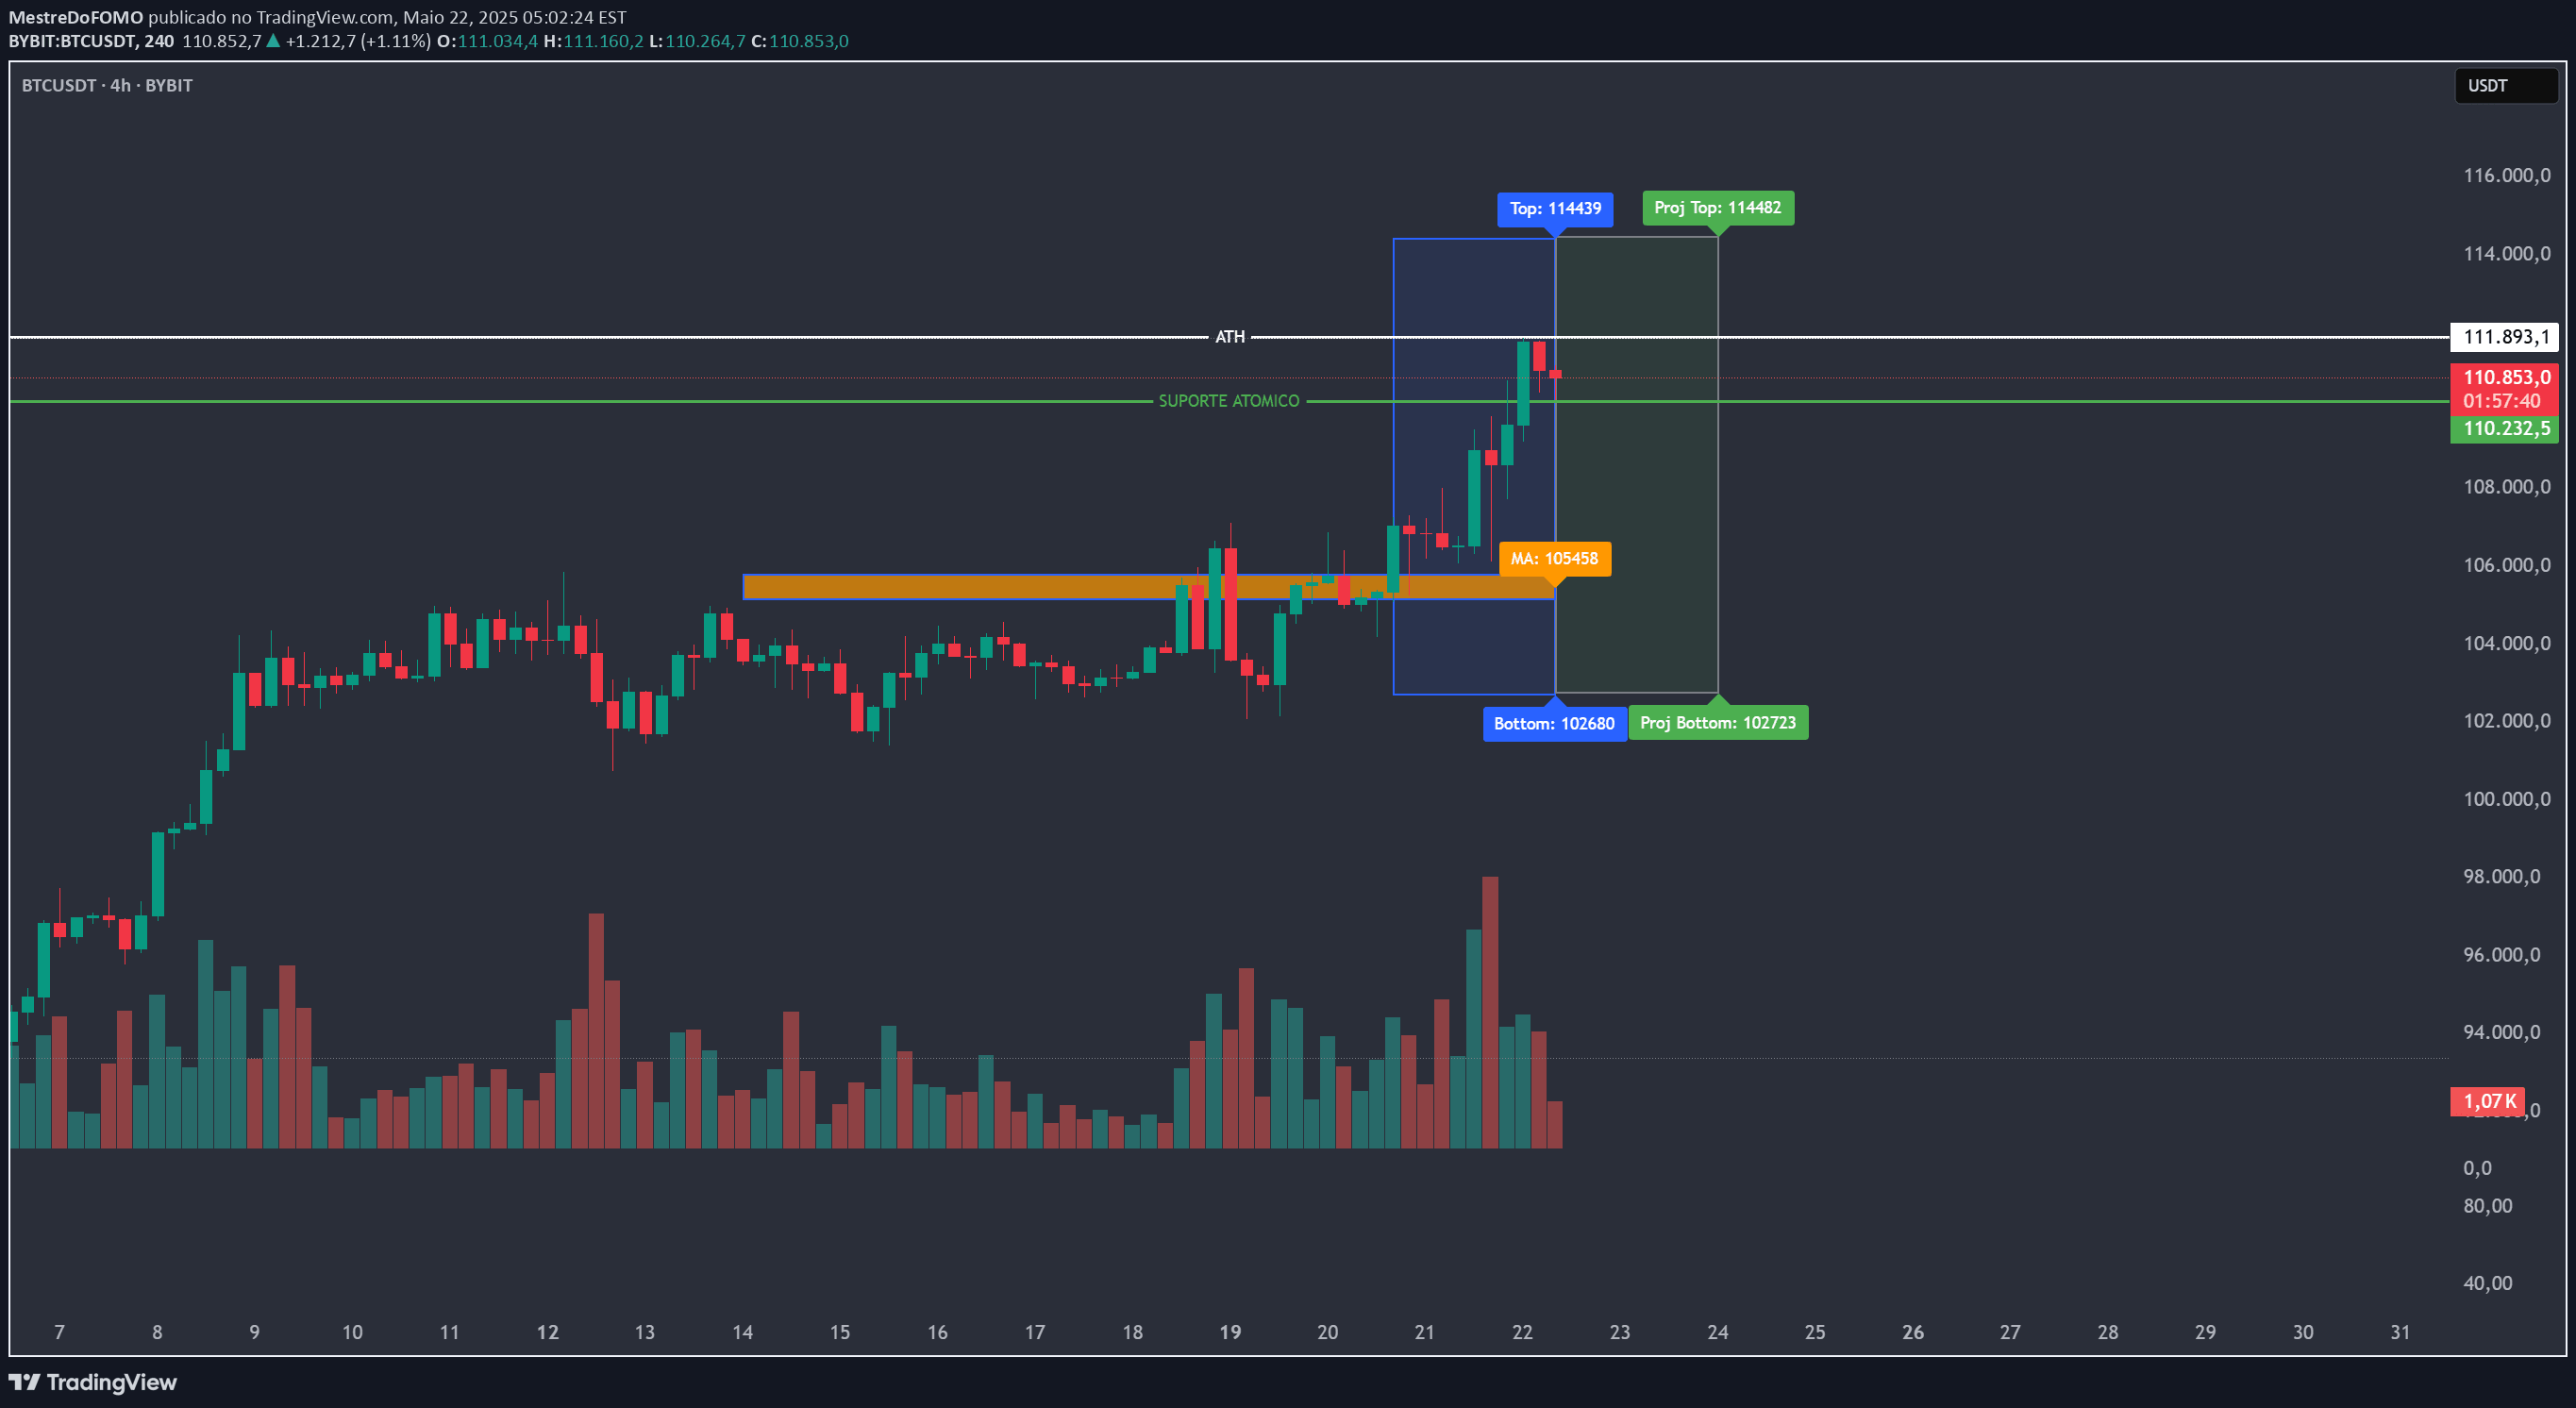
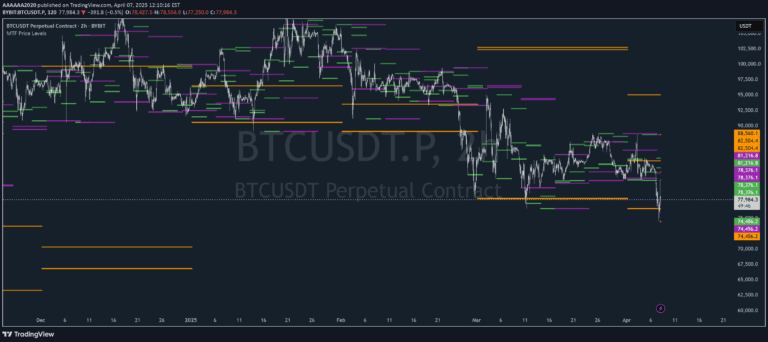
Single Prints indicator identifies unique price levels with minimal trading activity, helping traders spot potential support and resistance zones through color-coded visual representation.
Explore complementary indicator rolesHow it works
The Single Prints indicator tracks price levels where trading occurred with minimal follow-up activity, plotting these unique zones as color-coded lines on the chart. It analyzes price movements across multiple timeframes including daily, weekly, monthly, and yearly sessions, identifying areas with sparse trading volume.
Traders can customize the indicator by setting parameters like line distance, maximum number of lines displayed, and options to remove lines during price gaps. The color gradient from red to green helps visualize the age of each single print line, with older levels appearing in cooler colors and newer levels in warmer, more vibrant hues.
Why it may be useful
Single Prints provide traders with a visual representation of unique market activity, highlighting potential support and resistance levels that might be overlooked by traditional technical analysis. By identifying areas of minimal trading volume, traders can gain insights into market structure and potential price reversal zones.
The indicator's customizable nature allows traders to adapt it to different market conditions and trading styles, making it a versatile tool for understanding market dynamics. The color-coded approach helps quickly distinguish between older and newer significant price levels, enabling more informed trading decisions.
When to explore it
Single Prints are most effective in volatile markets with significant price movements and varying trading volumes. They work best when analyzing assets with complex price structures and when seeking to identify potential support and resistance zones beyond traditional technical indicators.
Traders should utilize this indicator during market transitions, trend reversals, and when exploring new trading opportunities across different timeframes. It is particularly useful for identifying hidden market structure, understanding price action dynamics, and developing more nuanced entry and exit strategies.
Keep exploring
What we’ve verified
Access, alerts and repainting behaviour have not been independently verified for this indicator. Check the creator’s current publication and settings.
General descriptions and classifications are recovered research. Verified details above identify the specific checks we have completed. Check the creator’s current publication for later changes.