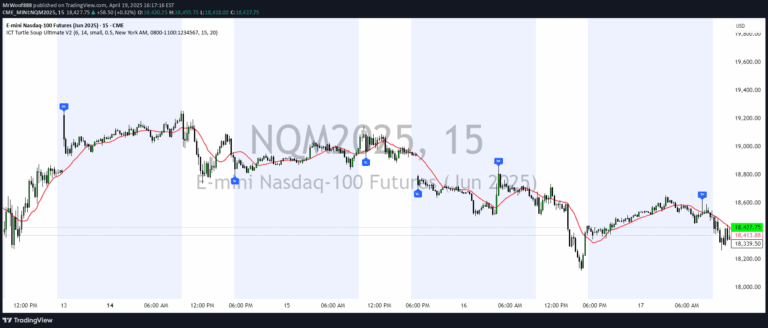
A multi-timeframe trading signal that tracks market trends through moving averages, identifies potential buying opportunities, and marks critical support and resistance levels.
Explore complementary indicator rolesHow it works
The signal uses three Simple Moving Averages (SMAs) to analyze market trends across different time horizons: 200-day (long-term), 50-day (mid-term), and 20-day (short-term). It tracks continuous green candle movements, calculating percentage gains and identifying potential buying signals based on specific price action criteria.
Additionally, the signal monitors Lifetime High (LTH) and calculates support levels at 30%, 50%, and 67% down from the LTH. It also tracks the 52-week low, providing traders with comprehensive visual markers of market dynamics and potential entry or exit points.
Why it may be useful
By integrating multiple trend indicators and support levels, this signal offers traders a holistic view of market movements and potential trading opportunities. The combination of moving averages helps identify trend direction and strength, while the support level calculations provide critical insights into potential market reversals and buying zones.
The signal's ability to highlight continuous green candles and mark significant price levels enables traders to make more informed decisions. It transforms complex market data into easily interpretable visual cues, helping traders understand both short-term momentum and long-term market trends.
When to explore it
This signal is most effective in markets with clear trending characteristics, where price movements show consistent directional momentum. It works particularly well in stocks, indices, and liquid markets where moving averages and support levels provide reliable trend information and potential entry points.
Traders should use this signal during periods of stable market conditions and avoid applying it during extreme volatility or news-driven market events. It is especially useful for traders seeking to confirm trend direction, identify potential support levels, and make data-driven trading decisions across different timeframes.
Keep exploring
What we’ve verified
Access, alerts and repainting behaviour have not been independently verified for this indicator. Check the creator’s current publication and settings.
General descriptions and classifications are recovered research. Verified details above identify the specific checks we have completed. Check the creator’s current publication for later changes.