
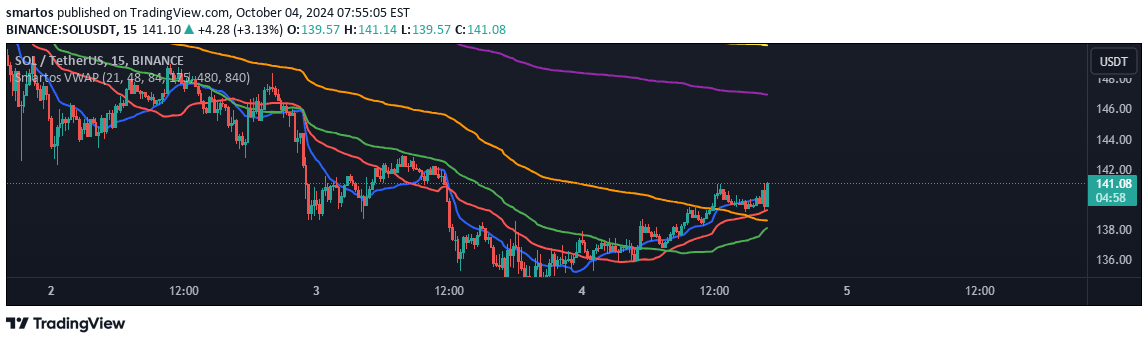
Smartos VWAP is a technical analysis tool that calculates volume-weighted average price across six customizable periods, helping traders identify price trends and potential support/resistance levels.
Explore complementary indicator rolesHow it works
The Smartos VWAP indicator calculates the Volume Weighted Average Price by multiplying each price point by its corresponding trading volume and then dividing by the total volume. It generates six distinct VWAP lines using different candle periods, allowing traders to see price dynamics across multiple timeframes.
Each VWAP line represents the average price weighted by volume for a specific period, with default settings of 21, 48, 84, 175, 480, and 840 candles. The lines are color-coded for easy differentiation, providing a visual representation of price movement relative to volume-adjusted average prices.
Why it may be useful
The Smartos VWAP indicator provides traders with a more nuanced view of price action by incorporating trading volume into the average price calculation. By weighing price points with their respective volumes, it offers a more accurate representation of market sentiment and price dynamics compared to simple mathematical averages.
This approach helps traders understand the true market value of a security by considering the impact of trading volume. The multiple VWAP lines enable traders to identify trends, potential support and resistance levels, and make more informed decisions about entry and exit points.
When to explore it
The Smartos VWAP indicator is most effective for traders seeking to understand price movement in relation to volume, particularly in liquid and actively traded markets. It works best for short to medium-term trading strategies, providing insights into intraday and daily price trends across different timeframes.
Traders can utilize this indicator during periods of high market activity, such as during earnings reports, economic announcements, or significant market events. It is particularly useful for scalpers and day traders who need to quickly assess price dynamics and make rapid trading decisions based on volume-weighted price information.
Keep exploring
What we’ve verified
Access, alerts and repainting behaviour have not been independently verified for this indicator. Check the creator’s current publication and settings.
General descriptions and classifications are recovered research. Verified details above identify the specific checks we have completed. Check the creator’s current publication for later changes.


