
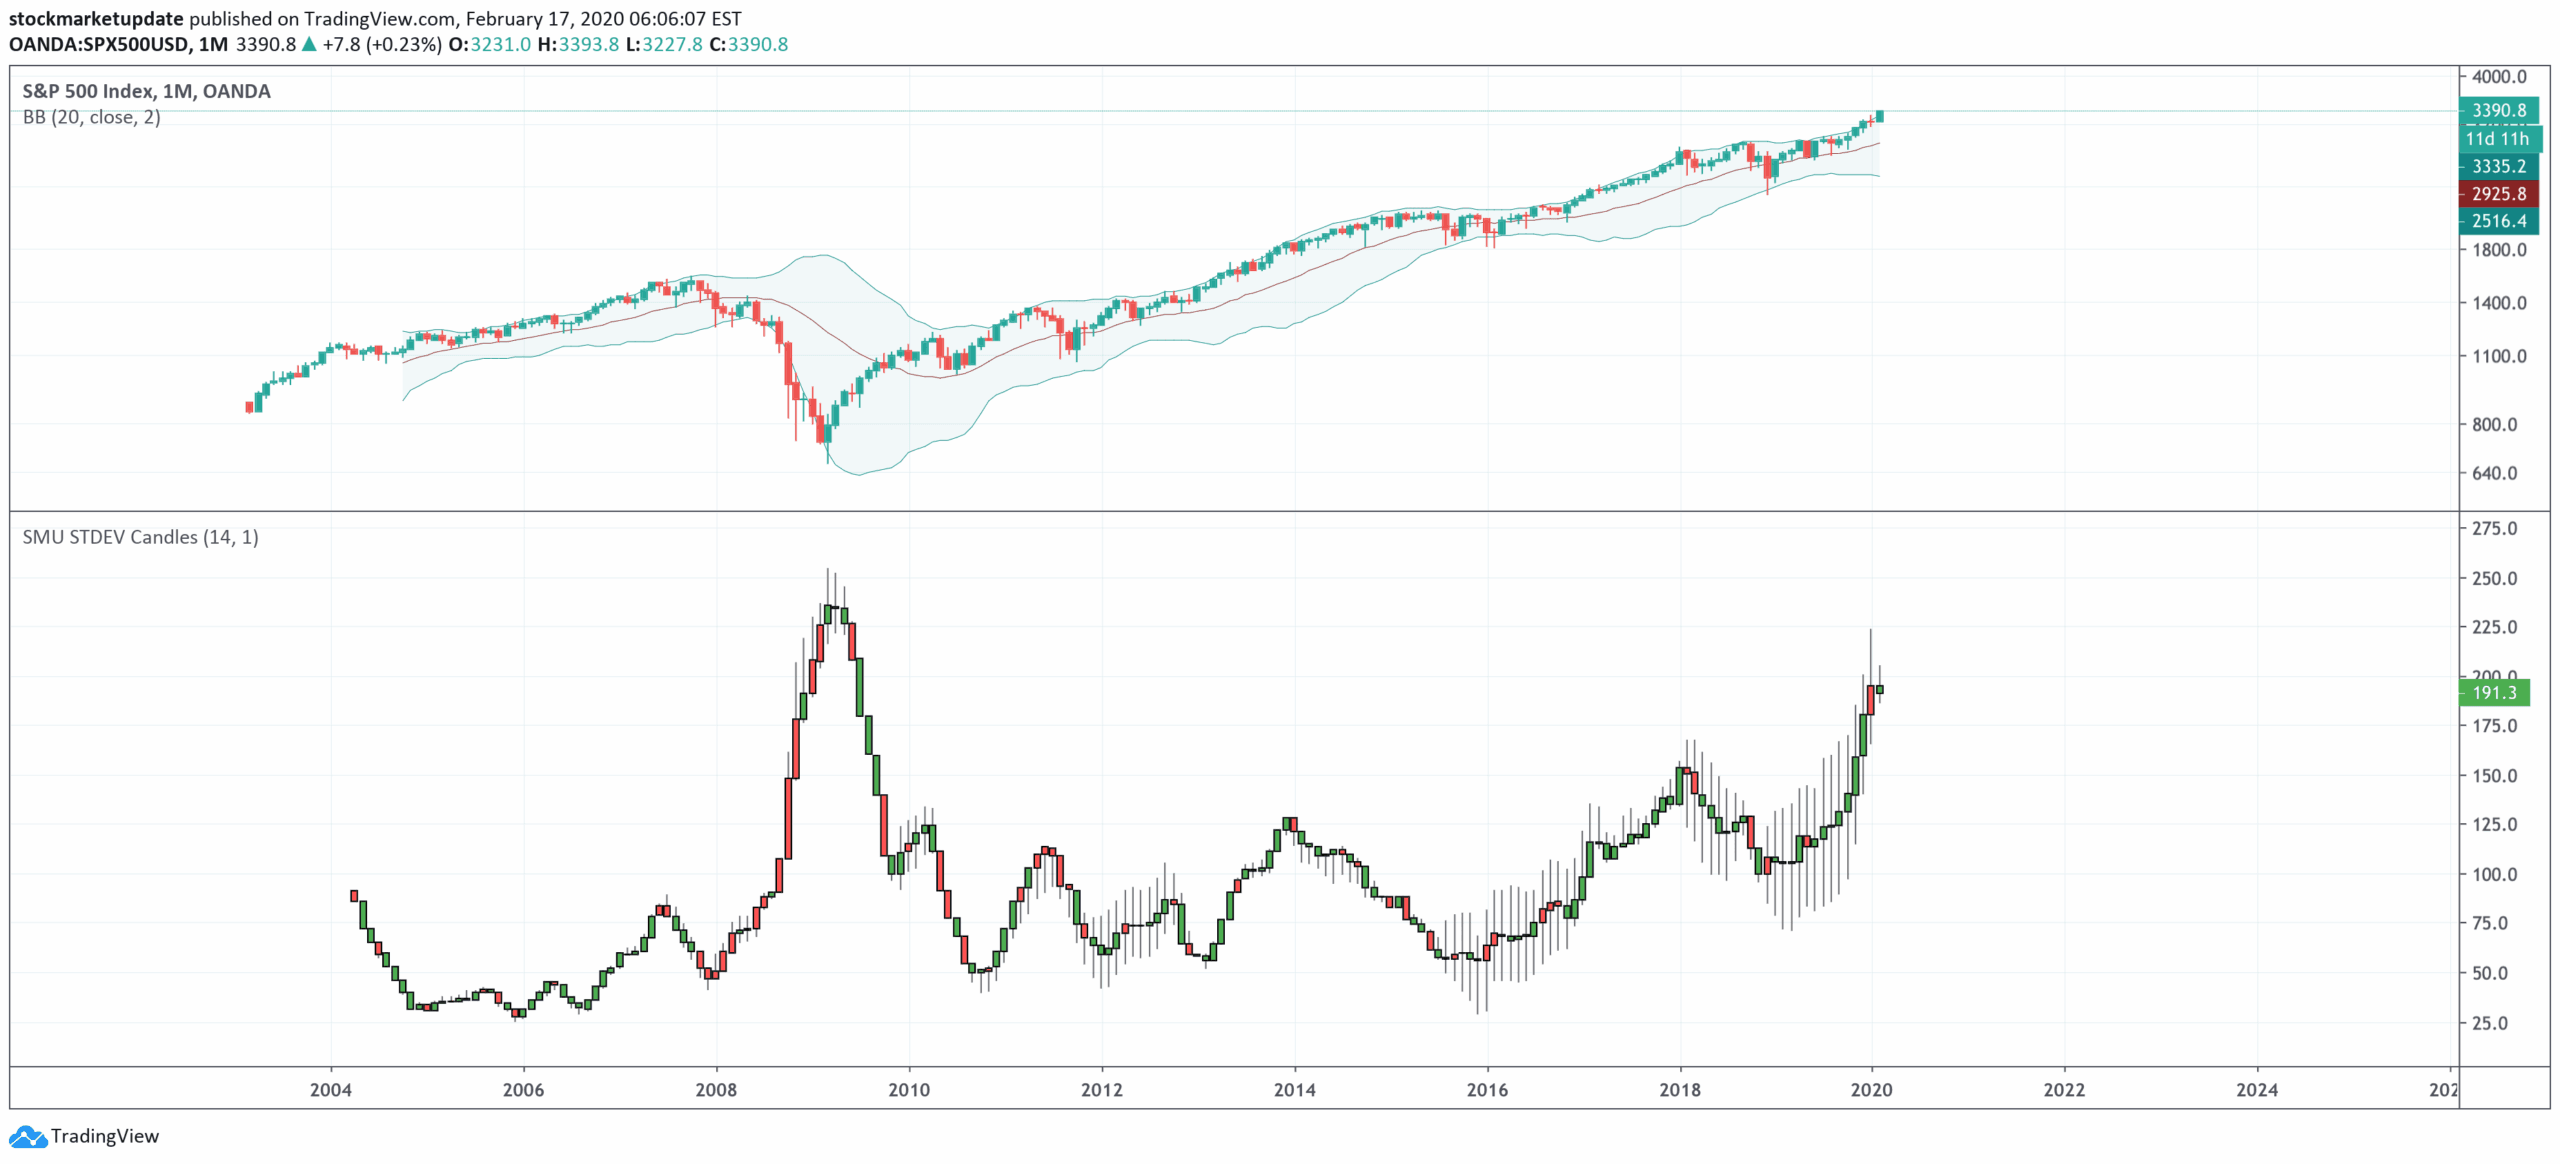
A standard deviation indicator presented in candle format to visualize price change variations, offering a unique perspective on market volatility and potential trend shifts.
Explore complementary indicator rolesHow it works
The STDEV indicator calculates the statistical dispersion of price changes by measuring how far prices deviate from their mean value. It transforms standard deviation calculations into a candle-like visual representation, allowing traders to see volatility changes more intuitively. By tracking the spread of price movements, the indicator helps identify periods of market compression or expansion.
The candle format enables direct comparison with actual price candles, making volatility patterns more apparent. Each candle represents the standard deviation of price changes over a specific period. The visualization helps traders understand underlying market dynamics beyond traditional line or histogram representations
Why it may be useful
Standard deviation analysis provides crucial insights into market behavior by quantifying price variability and potential trend strength. It helps traders understand market uncertainty and potential trend reversals by measuring price dispersal. The candle format makes volatility more comprehensible, allowing easier interpretation of complex statistical data.
Traders can use this visualization to identify periods of market stability or impending significant price movements. By presenting statistical information graphically, the indicator bridges the gap between mathematical analysis and visual trading strategies. This approach enables more nuanced understanding of market conditions beyond simple price tracking
When to explore it
The STDEV candle indicator works best during market transitions, periods of consolidation, and potential trend reversals. It is particularly effective in analyzing markets with significant historical volatility changes, such as major indices like SPX. Traders should apply this indicator when seeking to understand underlying market dynamics beyond surface-level price movements.
It proves valuable during economic announcements, earnings seasons, and periods of market uncertainty. The indicator can help identify potential breakout scenarios and assess market sentiment. Combining this tool with other technical indicators can provide more comprehensive market analysis
Keep exploring
What we’ve verified
Access, alerts and repainting behaviour have not been independently verified for this indicator. Check the creator’s current publication and settings.
General descriptions and classifications are recovered research. Verified details above identify the specific checks we have completed. Check the creator’s current publication for later changes.


