
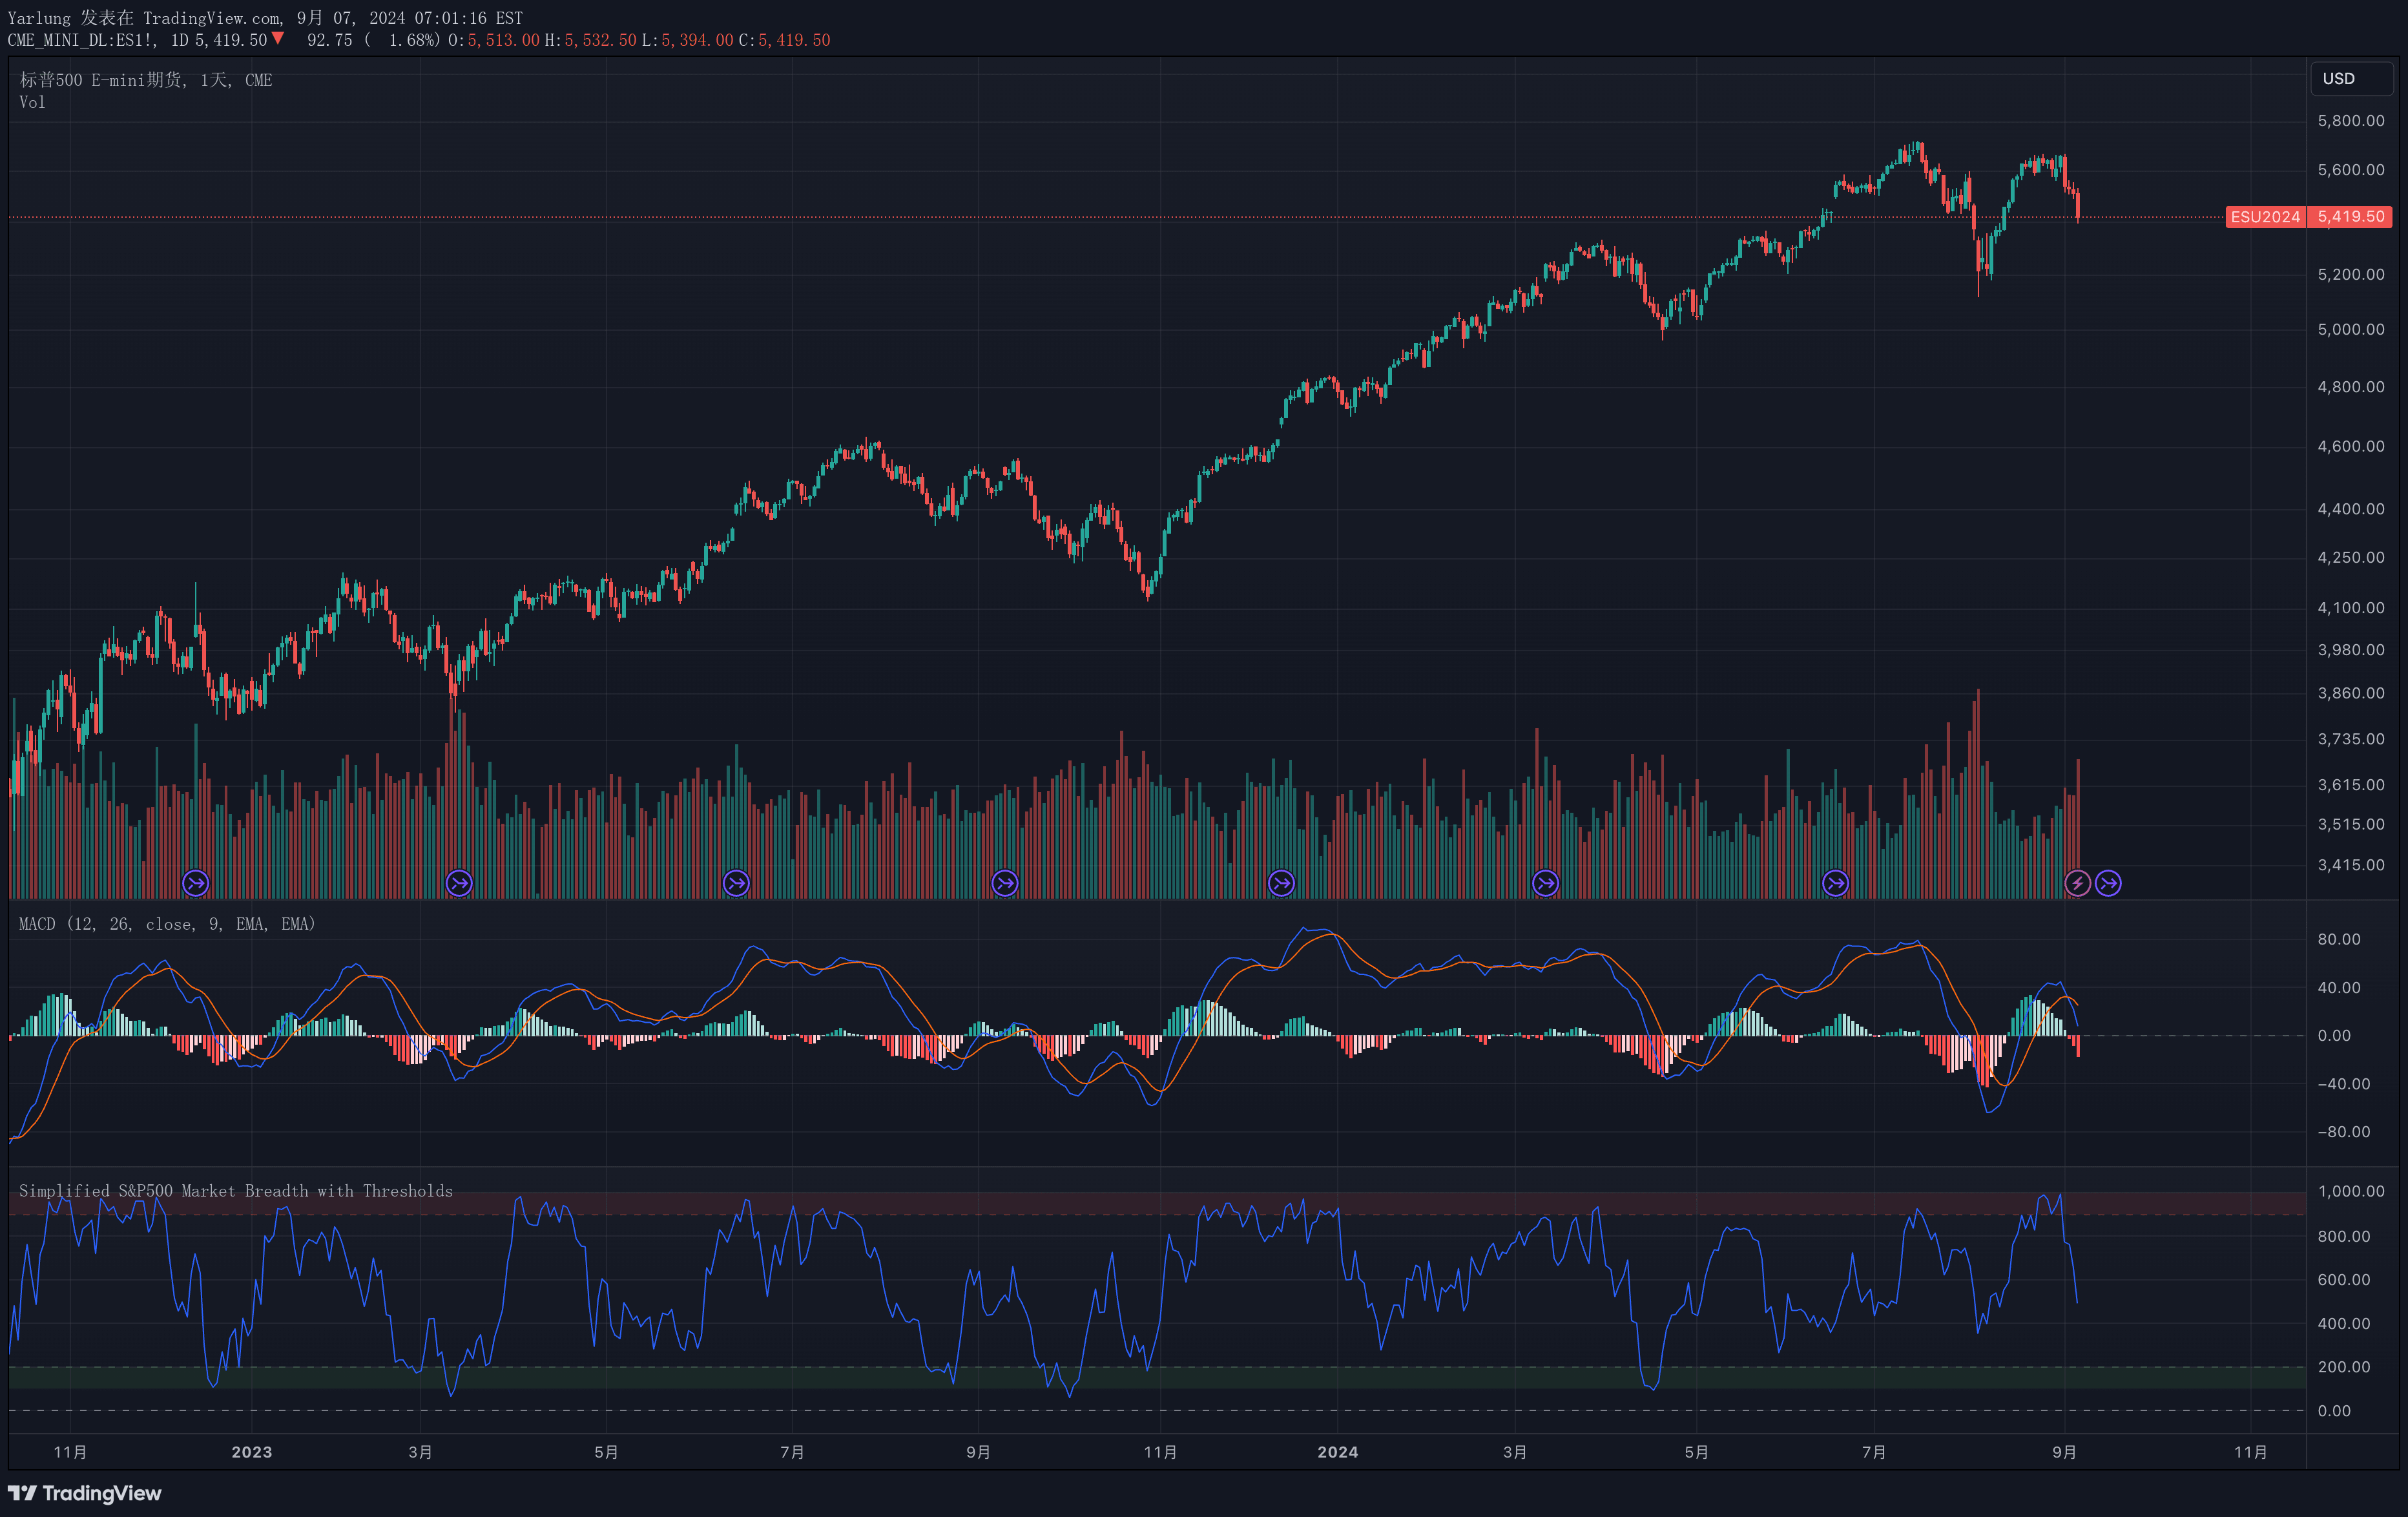
The MA20 Market Breadth Indicator tracks the percentage of assets trading above their 20-day moving average, revealing market sentiment and potential trend strength or weakness across various financial markets.
Explore complementary indicator rolesHow it works
The MA20 Market Breadth Indicator calculates the percentage of assets trading above their 20-day moving average by tracking the number of individual assets rising or falling within a broader market. It systematically evaluates each asset's position relative to its short-term moving average, generating a cumulative percentage that represents overall market momentum.
By converting complex market data into a simple percentage, the indicator provides traders with an immediate snapshot of market health. The calculation considers multiple assets simultaneously, offering a comprehensive view beyond individual stock performance and creating a holistic perspective on market-wide trends and potential directional shifts.
Why it may be useful
The MA20 Market Breadth Indicator is crucial for traders seeking to understand broader market dynamics beyond individual asset performance. It offers a sophisticated yet intuitive method to assess market sentiment, revealing whether the majority of assets are trending upward or experiencing downward pressure. This comprehensive approach helps traders make more informed decisions by providing context about overall market conditions.
By transforming complex market data into a clear percentage, the indicator bridges the gap between raw financial information and actionable trading insights. Traders can quickly determine market strength, identify potential trend reversals, and adjust their strategies accordingly, making it an essential tool for managing risk and maximizing potential opportunities across different financial markets.
When to explore it
The MA20 Market Breadth Indicator is most effective during periods of significant market movement, particularly when traders want to confirm broader trend directions across multiple assets. It provides optimal insights during trending markets where assets are showing consistent directional movement, helping traders validate their existing strategies and potential entry or exit points.
Traders should utilize this indicator when seeking to understand market-wide sentiment, especially during times of economic uncertainty or significant sector rotations. It becomes particularly valuable when combined with other technical indicators, offering a more comprehensive view of market conditions and helping traders make more nuanced and informed trading decisions across various financial markets.
Keep exploring
What we’ve verified
Access, alerts and repainting behaviour have not been independently verified for this indicator. Check the creator’s current publication and settings.
General descriptions and classifications are recovered research. Verified details above identify the specific checks we have completed. Check the creator’s current publication for later changes.




