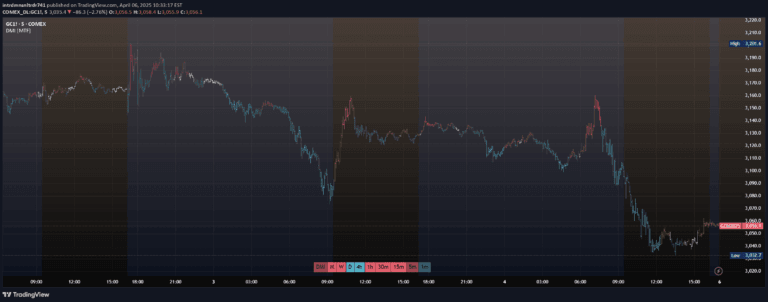
A Fibonacci-weighted moving average indicator that helps identify potential trend reversals by tracking color changes and price consolidation phases.
Explore complementary indicator rolesHow it works
The Fibonacci-weighted moving average (FWMA) calculates a dynamic moving average using Fibonacci sequence weights, giving more significance to recent price data. It generates visual color signals by changing from red to light red or green to light green, indicating potential trend transitions.
The indicator tracks price behavior during these color shifts, paying special attention to consolidation phases. By analyzing both the moving average's color changes and the market's price structure, traders can gain insights into potential trend reversals and market dynamics.
Why it may be useful
This indicator provides traders with a nuanced approach to understanding market trends by combining weighted moving average calculations with color-coded visual signals. It offers a more sophisticated method of trend analysis that goes beyond traditional moving average techniques, helping traders identify subtle market shifts.
By highlighting potential trend reversals and incorporating price consolidation analysis, the indicator helps traders make more informed decisions. It reduces reliance on single-dimensional trend indicators and provides a more comprehensive view of market movements.
When to explore it
The Fibonacci-weighted moving average indicator is most effective in markets with clear trend structures and moderate volatility. It works best when traders want to capture early signs of potential trend changes and need a visual representation of market momentum.
Traders should utilize this indicator across multiple timeframes, from short-term scalping to longer-term swing trading. It is particularly useful during periods of market transition, when prices are showing signs of potential directional changes or consolidation.
Keep exploring
What we’ve verified
Access, alerts and repainting behaviour have not been independently verified for this indicator. Check the creator’s current publication and settings.
General descriptions and classifications are recovered research. Verified details above identify the specific checks we have completed. Check the creator’s current publication for later changes.