
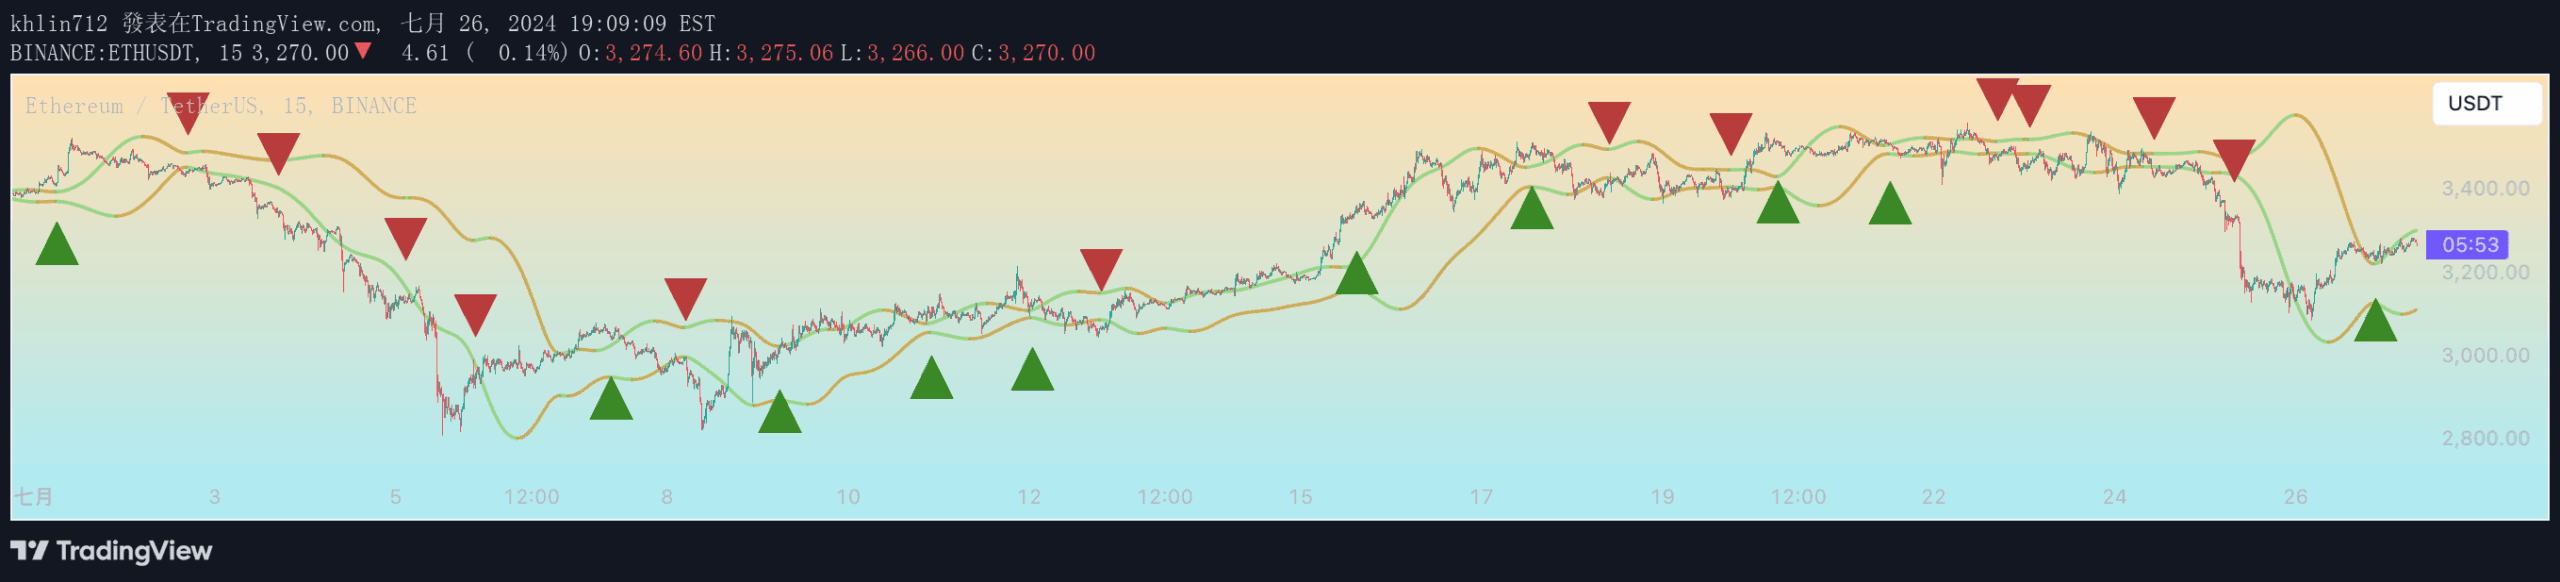
Squid Channel is a technical indicator combining weighted moving averages and Bollinger Bands to identify market trends, price fluctuations, and potential trading opportunities across different market conditions.
Explore complementary indicator rolesHow it works
The Squid Channel indicator operates by first calculating multiple weighted moving averages (WMA) from M1 to M5, which provide smoothed price data and help eliminate market noise. These moving averages are then used to create a comprehensive view of price dynamics, with each layer offering insights into different market trends.
Subsequently, the indicator calculates Bollinger Bands using the standard deviation of the fifth moving average (M5), generating upper and lower bands that define price fluctuation ranges. The MALine changes color based on trend direction - blue for upward, purple for downward, and yellow for no change - providing traders with an intuitive visual representation of market conditions.
Why it may be useful
The Squid Channel indicator is crucial for traders because it simplifies complex market analysis by integrating multiple technical analysis tools into a single, easy-to-understand visualization. By combining weighted moving averages and Bollinger Bands, it offers a comprehensive approach to understanding market trends, helping traders make more informed decisions about potential entry and exit points.
Moreover, the indicator's color-coded system and triangular trade signal markers make it accessible to both novice and experienced traders. Its ability to generate long and short trade signals, coupled with built-in alert functionality, ensures that traders can quickly identify and respond to potential market opportunities across various trading timeframes.
When to explore it
The Squid Channel indicator is most effective in markets with clear trending characteristics, where price movements show consistent directional momentum. It performs exceptionally well in liquid markets with sufficient trading volume, such as major forex pairs, stock indices, and highly traded commodities, where price trends are more pronounced and reliable.
Traders should consider using this indicator during periods of moderate to high market volatility, where price fluctuations provide more meaningful signals. It is particularly useful when combined with other technical analysis tools, as its multi-layered approach helps confirm trading hypotheses and reduce the likelihood of false signals.
Keep exploring
What we’ve verified
Access, alerts and repainting behaviour have not been independently verified for this indicator. Check the creator’s current publication and settings.
General descriptions and classifications are recovered research. Verified details above identify the specific checks we have completed. Check the creator’s current publication for later changes.




