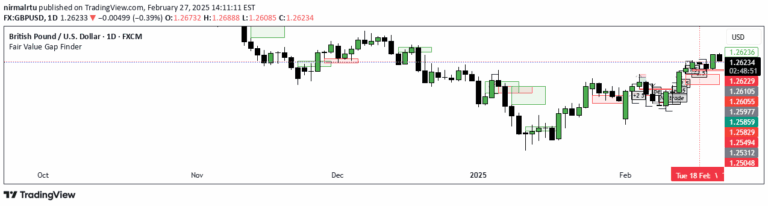
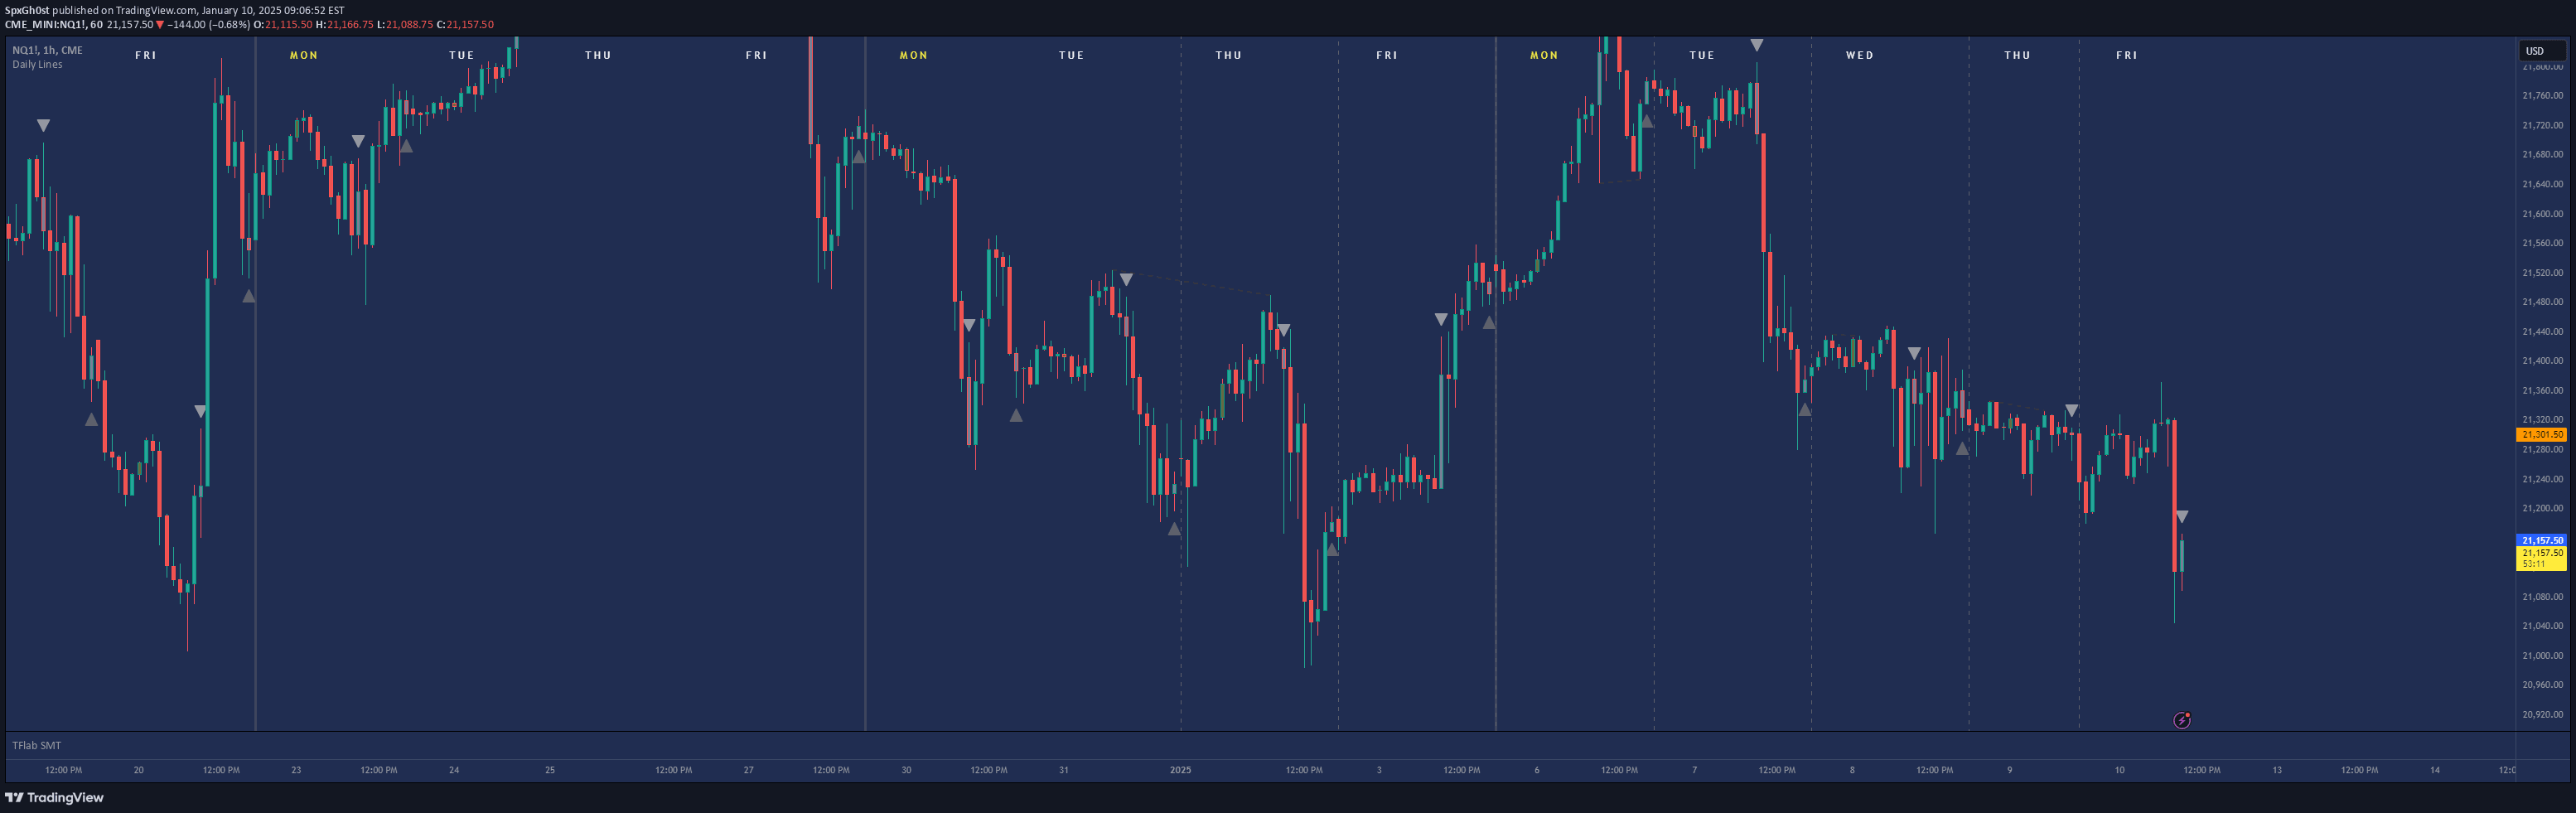
Identifies the nearest support and resistance levels from the current market price, providing traders with crucial reference points for potential price movements and strategic entry or exit points.
Explore complementary indicator rolesHow it works
Support and resistance levels are calculated by analyzing recent price action and identifying key zones where the price has historically struggled to break through. These levels are determined by tracking previous price peaks and troughs, which create natural barriers in the market where buying or selling pressure tends to concentrate.
Traders can measure the distance between the current price and these key levels in pips, which helps in understanding the potential price range and identifying potential trade setups. The proximity of the price to support or resistance levels can indicate potential reversal points or breakout opportunities, making this signal a valuable tool for technical analysis.
Why it may be useful
Support and resistance levels provide traders with critical insights into market psychology and potential price movements. By understanding where prices have historically stalled or reversed, traders can make more informed decisions about market entry and exit points, reducing the risk of trading against strong market momentum.
These levels help traders identify potential trading opportunities, set stop-loss and take-profit levels, and develop more strategic trading plans. They act as a visual representation of market sentiment, helping traders anticipate potential price action and make more calculated trading decisions.
When to explore it
Support and resistance levels are most effective in markets with clear historical price patterns and during periods of consolidated or ranging market conditions. They work best when the price is approaching these key levels, as this is where traders can anticipate potential trend reversals or breakouts.
Traders should use these levels in conjunction with other technical indicators to confirm potential trade signals. They are particularly useful in timeframes ranging from short-term (scalping and day trading) to medium-term trading strategies, providing valuable insights into potential market movements and price dynamics.
Keep exploring
What we’ve verified
Access, alerts and repainting behaviour have not been independently verified for this indicator. Check the creator’s current publication and settings.
General descriptions and classifications are recovered research. Verified details above identify the specific checks we have completed. Check the creator’s current publication for later changes.