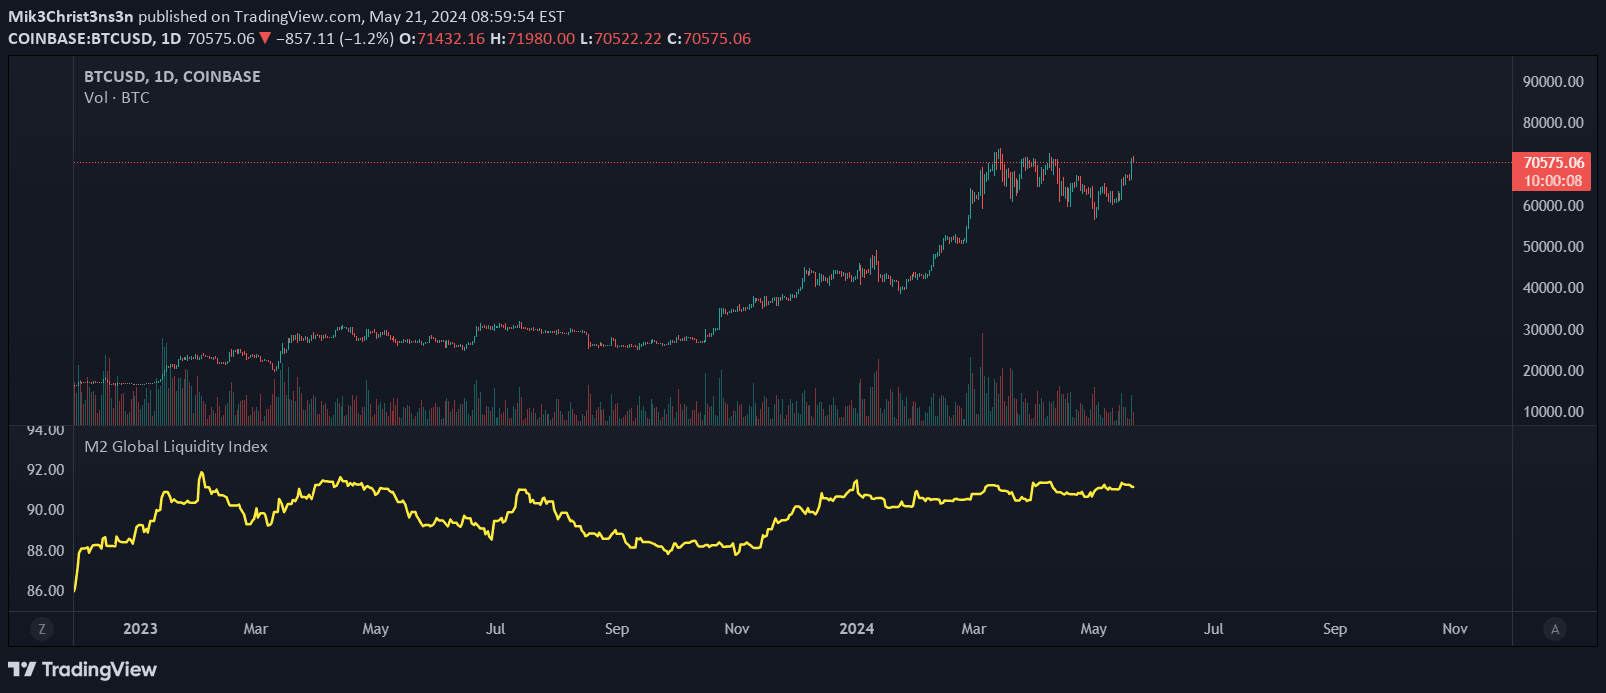
Stablecoin Delta tracks daily market capitalization changes for USDT and USDC, providing insights into cryptocurrency market liquidity and potential price movements.
Explore complementary indicator rolesHow it works
The Stablecoin Delta indicator analyzes daily changes in the market capitalization of major stablecoins like USDT and USDC using data from CryptoCap. It calculates the net daily change in market cap, presenting the information through a histogram that differentiates between positive and negative movements.
Traders can customize the visualization by applying either Simple Moving Average (SMA) or Exponential Moving Average (EMA) smoothing to the histogram and line chart. The indicator offers flexible color options, allowing users to adjust the display for better readability and more intuitive analysis of stablecoin supply trends.
Why it may be useful
Stablecoin supply is a critical indicator of cryptocurrency market liquidity and potential price movements. By tracking the daily changes in market capitalization, traders can gain valuable insights into market sentiment and potential shifts in cryptocurrency valuations.
The indicator provides a comprehensive view of market dynamics, helping traders make more informed investment decisions. It serves as a supplementary tool for understanding broader market trends, offering a unique perspective on the cryptocurrency ecosystem that goes beyond traditional price analysis.
When to explore it
The Stablecoin Delta indicator is most effective during periods of market uncertainty or significant cryptocurrency market movements. Traders can use it to gauge market liquidity and potential trend changes, especially when examining the relationship between stablecoin supply and broader market conditions.
It is particularly useful for traders looking to develop both short-term and long-term trading strategies. The indicator can help identify potential market shifts, provide context for price movements, and offer insights into overall market sentiment across different timeframes.
Keep exploring
What we’ve verified
Access, alerts and repainting behaviour have not been independently verified for this indicator. Check the creator’s current publication and settings.
General descriptions and classifications are recovered research. Verified details above identify the specific checks we have completed. Check the creator’s current publication for later changes.