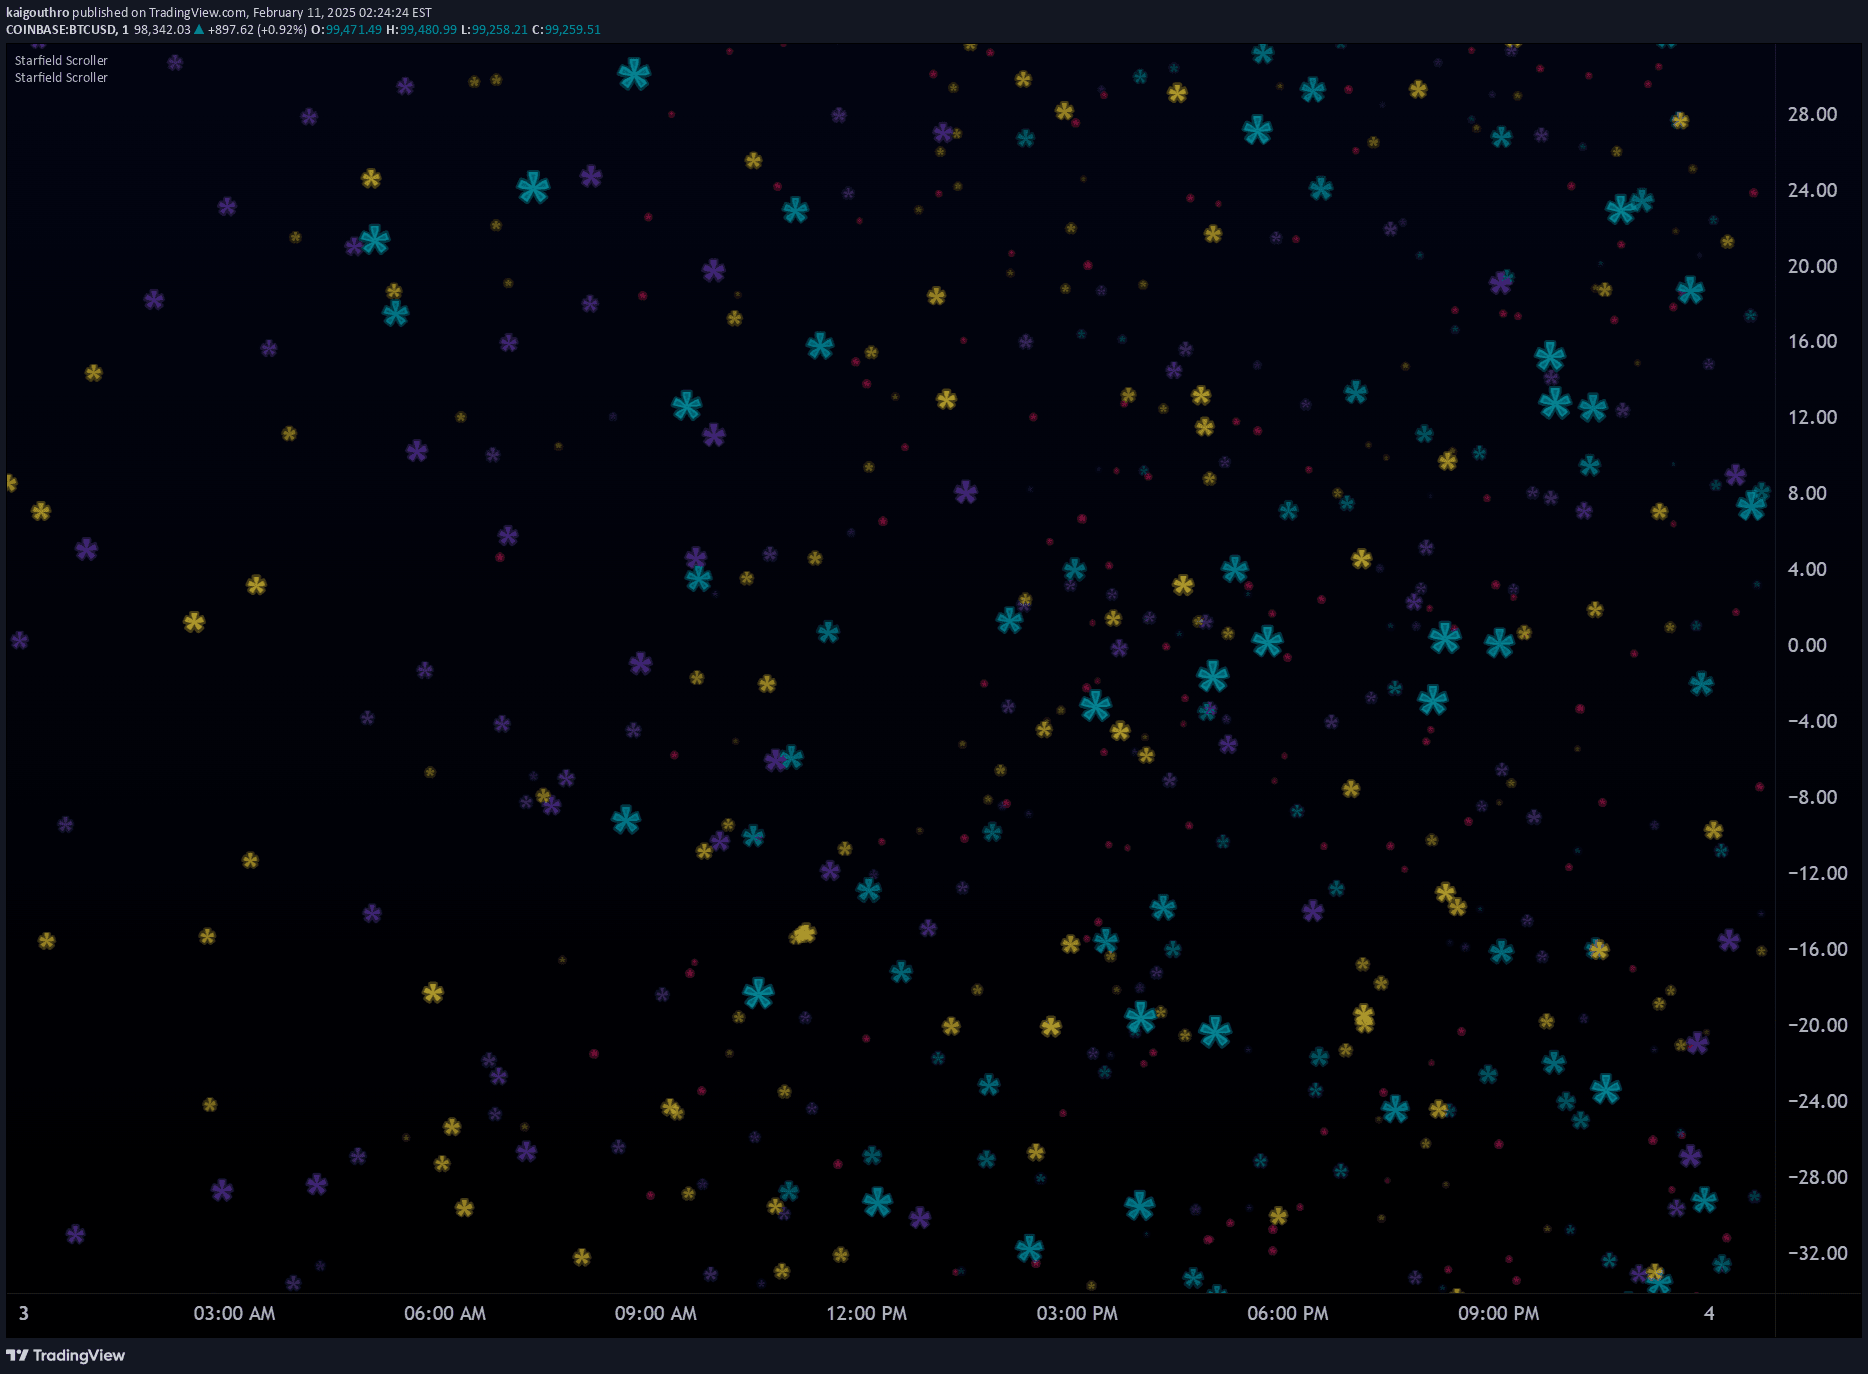
A custom script that creates an animated starfield visualization on trading charts, generating multiple star layers with configurable parameters for visual enhancement.
Explore complementary indicator rolesHow it works
The starfield script generates multiple independent star layers by creating stars with random X and Y coordinates within defined chart boundaries. Each star is assigned a unique speed factor that determines its movement speed and transparency, creating a dynamic visual effect.
The script maintains a dynamic array of Star structures, tracking each star's creation bar, location, speed, and display label. On each new bar, new stars are generated and added to the array, while existing stars move horizontally based on their individual speed factors, with off-screen stars being automatically deleted to manage system resources.
Why it may be useful
Visual indicators like the starfield script can help traders maintain engagement and reduce chart fatigue by introducing dynamic, aesthetically pleasing elements to their trading environment. By providing a customizable visualization tool, traders can personalize their charts and potentially reduce visual monotony.
While the starfield does not provide direct trading signals, it demonstrates advanced Pine Script™ programming techniques, showcasing the potential for creating complex visual effects and custom indicators that enhance the trading experience.
When to explore it
The starfield script is primarily designed for visual enhancement and should be used when traders want to add a creative, dynamic element to their charts without impacting technical analysis. It is most suitable for traders interested in exploring custom scripting capabilities and creating unique chart visualizations.
Traders should be mindful of performance limitations and avoid excessive star configurations that might strain system resources. The script is best used as a supplementary visual tool that does not interfere with core trading analysis or decision-making processes.
Keep exploring
What we’ve verified
Access, alerts and repainting behaviour have not been independently verified for this indicator. Check the creator’s current publication and settings.
General descriptions and classifications are recovered research. Verified details above identify the specific checks we have completed. Check the creator’s current publication for later changes.