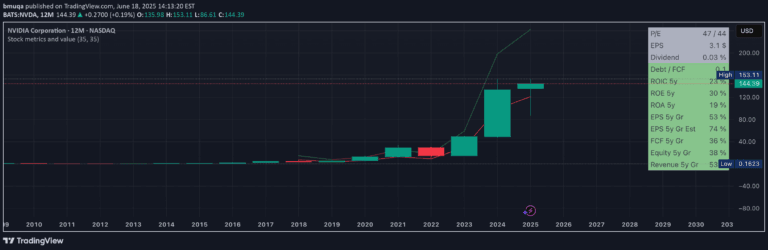
An advanced enterprise value indicator that visualizes a company's true market value by tracking enterprise value, debt, and cash metrics with customizable charting options.
Explore complementary indicator rolesHow it works
The Enterprise Value Indicator calculates a company's comprehensive market value by integrating multiple financial metrics beyond traditional market capitalization. It combines market cap, total debt, and cash equivalents to provide a more holistic view of a company's financial standing.
The indicator plots the Enterprise Value line on the chart with customizable color trends, allowing traders to visually track the company's valuation dynamics. Additionally, it generates a key metrics table showing average, highest, and lowest enterprise values, along with the MC-EV differential to help investors understand the company's financial leverage and potential growth opportunities.
Why it may be useful
Enterprise Value provides a more accurate representation of a company's true worth compared to market capitalization by accounting for critical financial components like debt and cash reserves. This comprehensive approach gives investors a deeper understanding of a company's financial health and potential investment value beyond surface-level market pricing.
By visualizing enterprise value alongside debt and cash metrics, traders can make more informed decisions about a company's financial stability and growth potential. The ability to chart and analyze these interconnected financial indicators helps investors identify potential risks and opportunities that might be overlooked with traditional valuation methods.
When to explore it
The Enterprise Value Indicator is most effective for investors conducting fundamental analysis and long-term investment research across various market sectors. It is particularly useful when evaluating companies with complex financial structures, significant debt levels, or those undergoing strategic financial transformations.
Traders should utilize this indicator when comparing companies within the same industry, assessing potential acquisition targets, or understanding a company's true financial position beyond its market capitalization. It is especially valuable for swing traders and investors looking to make strategic, well-informed investment decisions based on comprehensive financial insights.
Keep exploring
What we’ve verified
Access, alerts and repainting behaviour have not been independently verified for this indicator. Check the creator’s current publication and settings.
General descriptions and classifications are recovered research. Verified details above identify the specific checks we have completed. Check the creator’s current publication for later changes.