Stablecoin Supply Ratio Oscillator
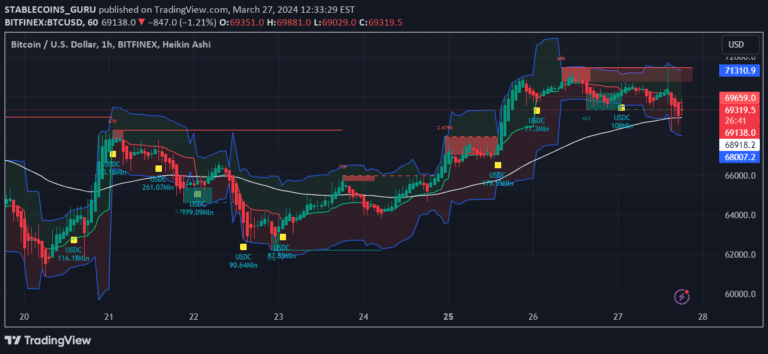
The Stablecoin Supply Ratio Oscillator analyzes market sentiment by comparing Bitcoin's market cap to stablecoin market caps, using z-score transformation to identify potential market turning points.
Explore 11,183 indicators. Filter beyond the obvious.
Discover the tools that fit the way you trade.
11,183 tools to explore
The Stablecoin Supply Ratio Oscillator analyzes market sentiment by comparing Bitcoin's market cap to stablecoin market caps, using z-score transformation to identify potential market turning points.
A custom index generator allowing investors to create personalized market indices by selecting global securities, tracking performance, and analyzing specific market segments.
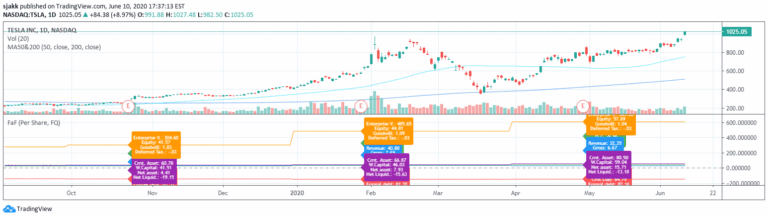
A comprehensive financial health indicator that analyzes quarterly reporting data, displaying trends in debt, cash, and earnings through a unique Pine Script approach for comprehensive market analysis.
A tool that tracks the market capitalization of major Stablecoins to provide insights into crypto market liquidity and potential price movements.
A USDT inflow tracker that monitors Tether market cap changes to identify potential market manipulation and significant cryptocurrency market movements.
The Buffett Valuation Indicator assesses stock market valuation by comparing total market capitalization to GDP, using Bollinger Bands to identify overvalued or undervalued market conditions.
The Stablecoin Supply Ratio (SSR) indicator measures Bitcoin's market capitalization relative to stablecoin liquidity, providing insights into potential market capital flows and sentiment shifts.
A crypto market dominance tool that transforms market capitalization percentages into oscillators, providing visual insights into capital flow across different cryptocurrency sectors.
Measures futures market leverage by comparing open interest to market capitalization, revealing potential deleveraging risks and market dynamics.
A sophisticated Bitcoin market cap wave model using logarithmic regression and sinusoidal waves to predict potential market cycles and price movements based on halving events.
A specialized trading tool tracking trends and money flow in meme coins and DEX tokens through category indices, Fibonacci levels, and advanced market analysis.
An advanced enterprise value indicator that visualizes a company's true market value by tracking enterprise value, debt, and cash metrics with customizable charting options.
Likes, views, and comments are historical TradingView snapshots. They describe attention, not trading performance.