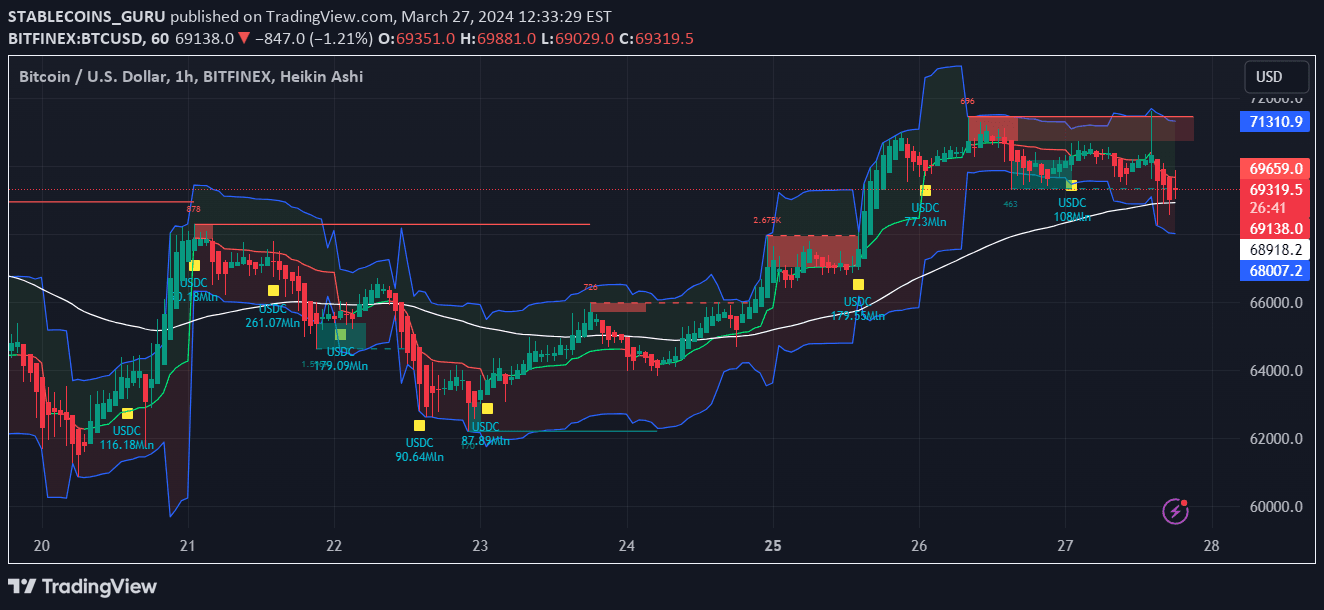
A USDT inflow tracker that monitors Tether market cap changes to identify potential market manipulation and significant cryptocurrency market movements.
Explore complementary indicator rolesHow it works
The USDT Inflow Tracker continuously monitors the market capitalization of Tether (USDT) and USDC across different timeframes. It compares the current candle's volume with previous candles to detect significant inflows of stablecoin capital.
When the inflow exceeds predefined thresholds (which vary by timeframe), the script generates a visual alert by plotting a green square on the chart. The thresholds range from 15 million for 5-minute timeframes to 900 million for daily timeframes, allowing traders to quickly identify potential market movements.
Why it may be useful
Tether (USDT) plays a crucial role in cryptocurrency markets, often serving as a key indicator of potential market manipulation or significant capital movement. By tracking large USDT inflows, traders can gain insights into potential market trends and prepare for possible price actions.
The indicator helps traders understand when substantial capital is entering the crypto market, which can signal upcoming volatility or trend changes. This information is particularly valuable for identifying potential entry and exit points before major market movements occur.
When to explore it
The USDT Inflow Tracker is most effective during periods of market uncertainty or when tracking potential large-scale market movements. It works best for traders who want to stay ahead of potential market shifts driven by stablecoin capital injections.
Traders should pay special attention to this indicator during key market events, such as major cryptocurrency news, regulatory announcements, or periods of high market volatility. It is particularly useful for short-term trading strategies that require quick decision-making based on real-time market capital flows.
Keep exploring
What we’ve verified
Access, alerts and repainting behaviour have not been independently verified for this indicator. Check the creator’s current publication and settings.
General descriptions and classifications are recovered research. Verified details above identify the specific checks we have completed. Check the creator’s current publication for later changes.