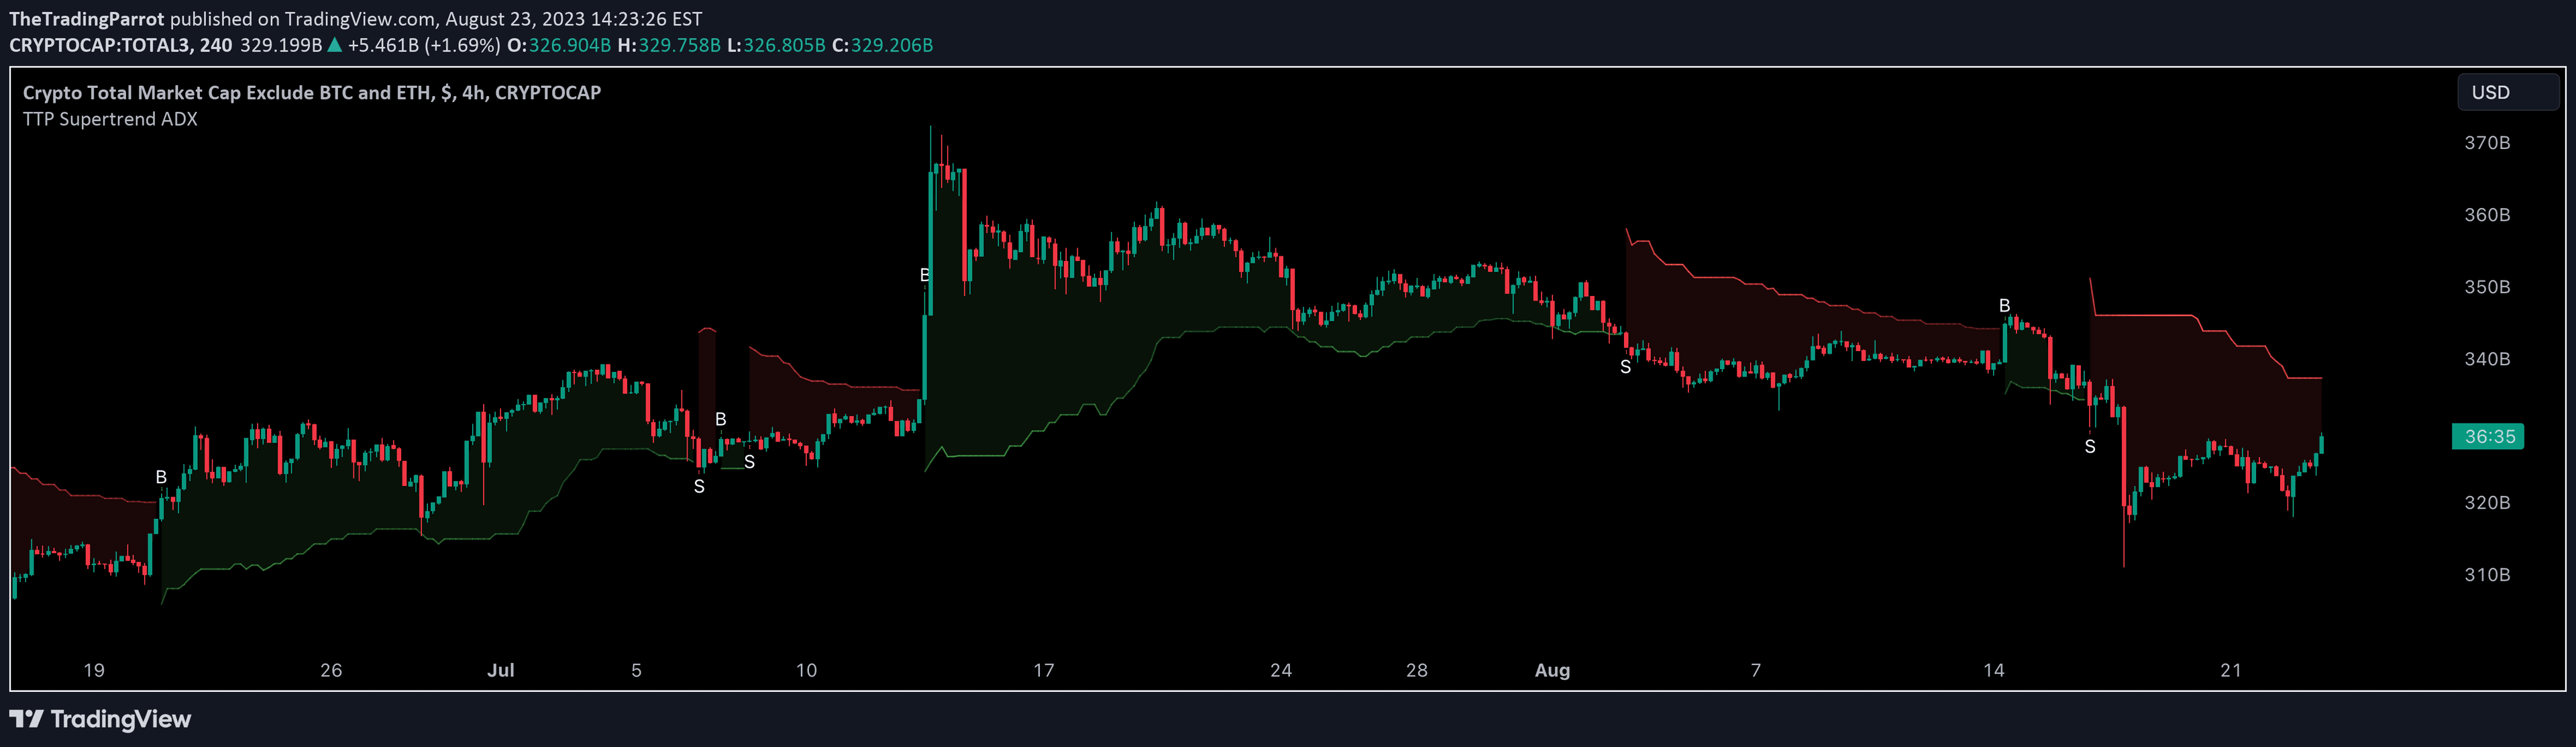
A versatile SuperTrend toolkit that extends trend analysis by integrating the SuperTrend algorithm with various indicators, enabling comprehensive market trend insights across different data sources.
Explore complementary indicator rolesHow it works
The SuperTrend Toolkit calculates trend dynamics using the Average-True-Range (ATR) and price action, creating dynamic support and resistance levels that adapt to changing market conditions. It innovatively uses a user-defined type to store external input data, allowing flexible price source integration beyond traditional chart data.
By processing data through a custom-built SuperTrend with ATR functions, the toolkit can derive trend indicators from various data sources. The algorithm dynamically adjusts trend direction based on price movements, using a factor and length parameter to calculate upper and lower trend boundaries.
Why it may be useful
The SuperTrend Toolkit addresses critical limitations in traditional trend analysis by providing unprecedented flexibility in indicator application and data source integration. By extending the SuperTrend algorithm's reach, traders can gain deeper insights into market trends across different indicators and data streams.
This approach empowers traders to develop more nuanced and comprehensive trading strategies, enabling trend analysis on non-price indicators and expanding the traditional boundaries of technical analysis. The toolkit's universal compatibility makes it a powerful tool for traders seeking advanced trend identification methods.
When to explore it
The SuperTrend Toolkit is most effective when traders want to analyze trends across multiple indicators beyond traditional price data. It excels in scenarios where standard trend indicators provide limited insights, such as when working with volume, oscillator, or complex custom indicators.
Traders can leverage this toolkit in volatile markets, during trend transitions, or when seeking additional confirmation of market direction from alternative data sources. Its adaptability makes it particularly useful for developing sophisticated trading strategies that require multi-dimensional trend analysis.
Keep exploring
What we’ve verified
Access, alerts and repainting behaviour have not been independently verified for this indicator. Check the creator’s current publication and settings.
General descriptions and classifications are recovered research. Verified details above identify the specific checks we have completed. Check the creator’s current publication for later changes.