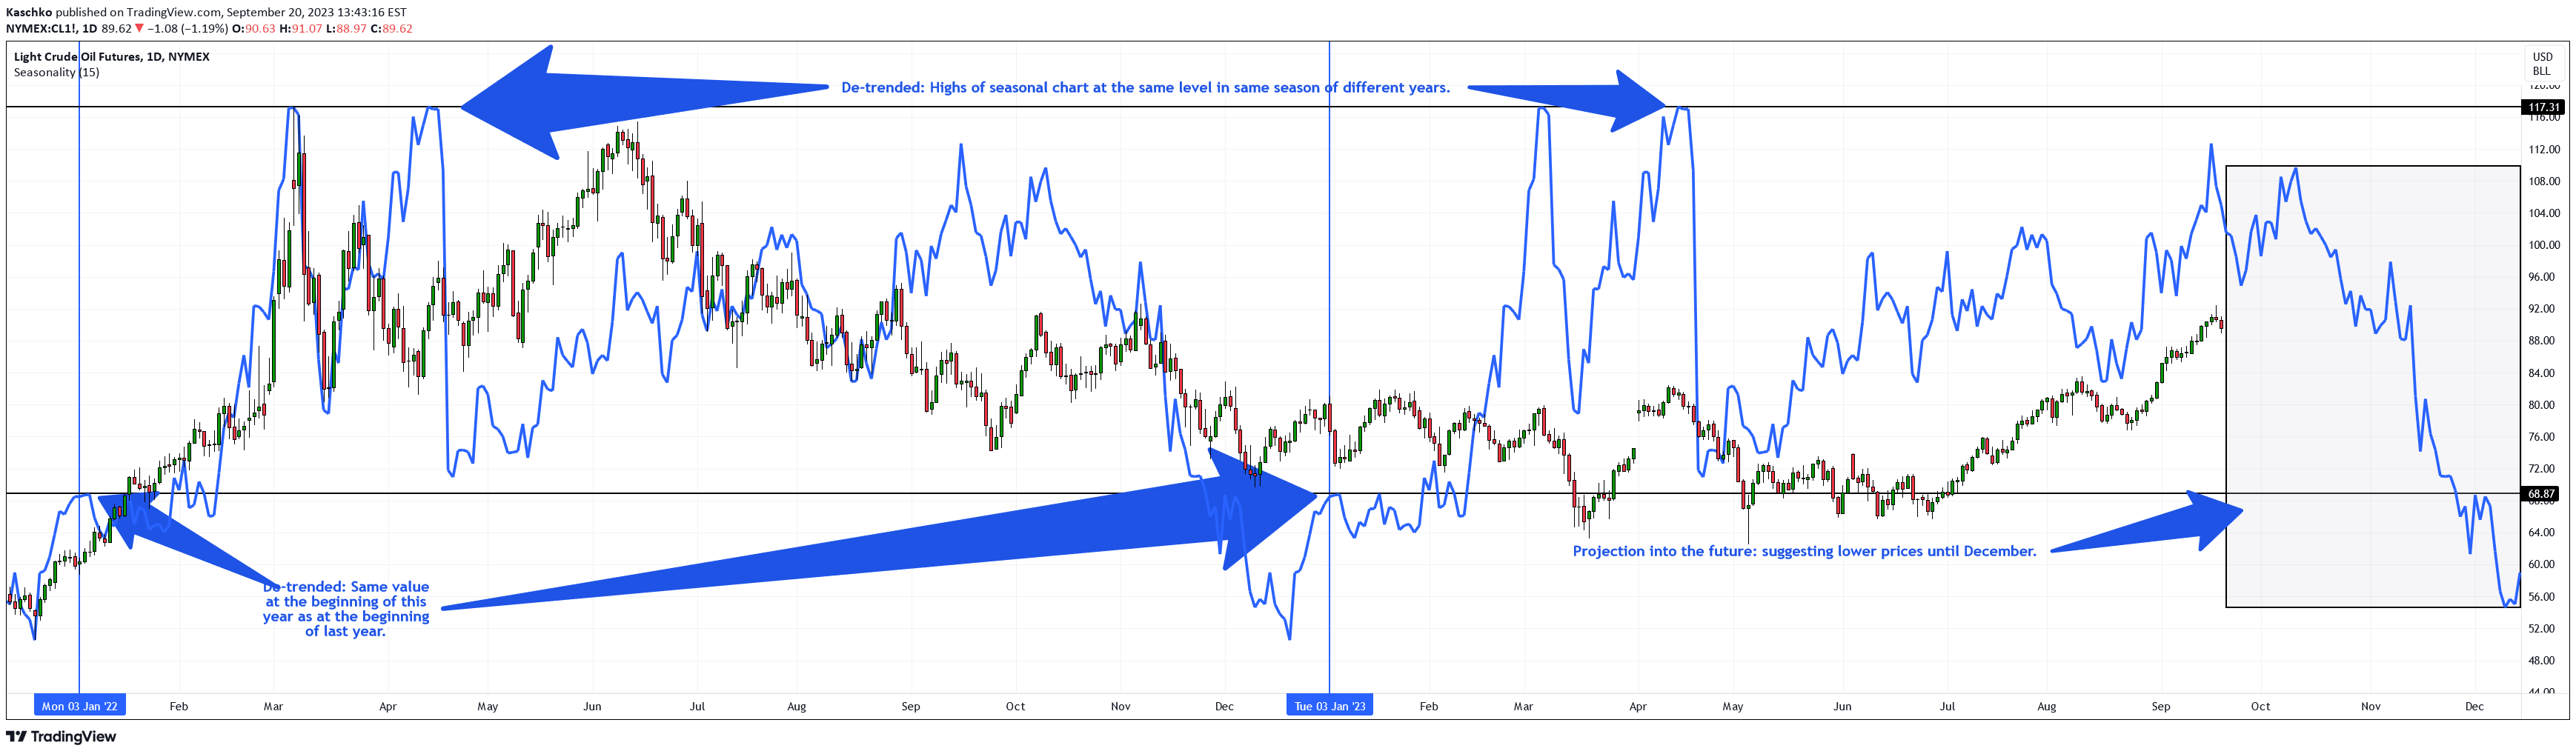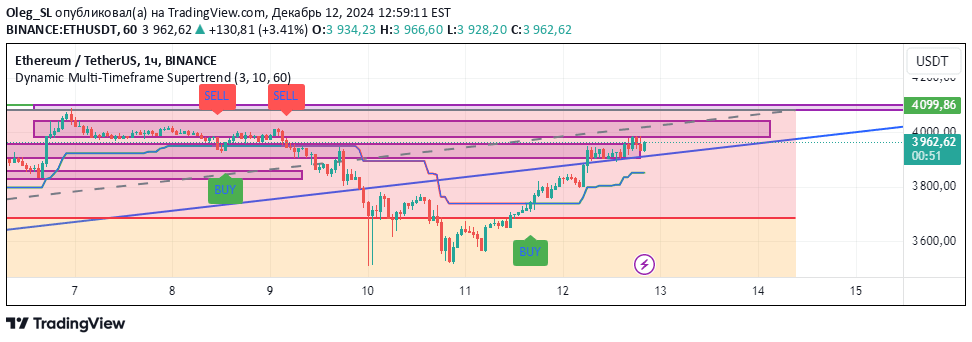
Supertrend is a dynamic trend-following indicator that generates buy and sell signals by tracking price movements relative to a dynamic trend line across different timeframes.
Explore complementary indicator rolesHow it works
The Supertrend indicator calculates a dynamic trend line by analyzing price movements and volatility. It automatically adjusts its position based on whether the current price is above or below the previous trend line, creating a responsive trend tracking mechanism.
When the price crosses above the Supertrend line, it generates a buy signal, and when it crosses below, it produces a sell signal. The indicator also calculates trend lines for multiple timeframes, allowing traders to get a comprehensive view of market dynamics across different time periods.
Why it may be useful
The Supertrend indicator provides traders with a clear visual representation of market trends and potential entry and exit points. By dynamically adjusting its trend line, it helps traders quickly identify changes in market momentum and potential trend reversals.
Its ability to work across multiple timeframes makes it a versatile tool for traders seeking to confirm signals and understand broader market movements. The color-coded display (green/red) makes it easy to interpret market conditions at a glance.
When to explore it
Supertrend works best in trending markets where prices are moving consistently in a particular direction. It is particularly effective in markets with clear upward or downward momentum, helping traders capture significant price movements.
Traders should use Supertrend in conjunction with other indicators like RSI or MACD to filter out potential false signals, especially during sideways or choppy market conditions. It is recommended to test the strategy on historical data and validate signals across multiple timeframes before implementing in live trading.
Keep exploring
What we’ve verified
Access, alerts and repainting behaviour have not been independently verified for this indicator. Check the creator’s current publication and settings.
General descriptions and classifications are recovered research. Verified details above identify the specific checks we have completed. Check the creator’s current publication for later changes.