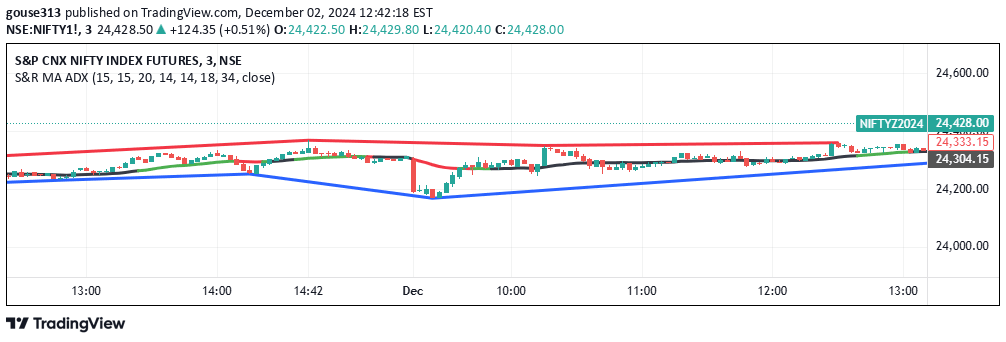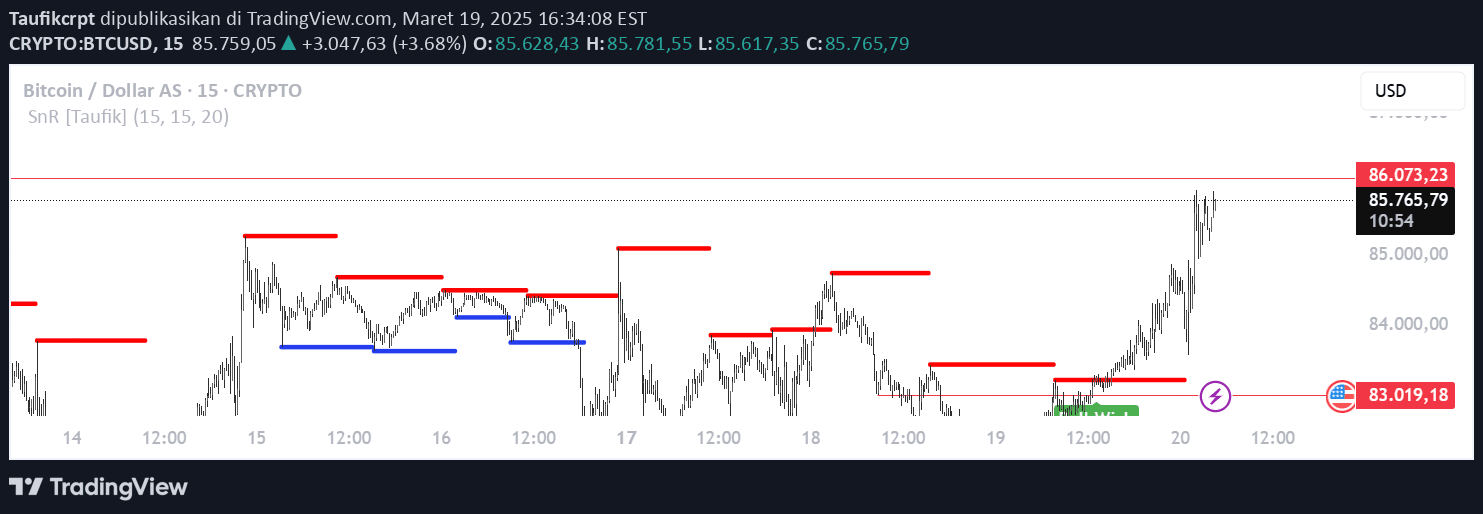
A TradingView indicator that automatically detects support and resistance levels using pivots, highlighting breakouts and price rejections with volume confirmation for trading decisions.
Explore complementary indicator rolesHow it works
The Support and Resistance Levels with Breaks indicator uses pivothigh and pivotlow algorithms to automatically identify key market levels. It plots red lines for resistance and blue lines for support based on price action patterns. The indicator analyzes price movement around these levels and detects breakouts when price crosses these levels with significant volume.
Breakouts are visually marked with color-coded 'B' labels to indicate directional movement. The system also identifies potential price reversals by detecting long wicks at support and resistance zones. These signals are generated through complex algorithmic analysis of price action and volume
Why it may be useful
Identifying support and resistance levels is crucial for understanding market dynamics and potential price movements. This indicator removes subjective manual drawing of levels by automating the process through mathematical calculations. Traders can quickly visualize key price zones where market sentiment might change.
Volume confirmation adds an extra layer of validation to breakout signals, reducing false signals. The indicator helps traders make more informed decisions by providing objective, data-driven insights into potential trend reversals and continuation patterns. It simplifies technical analysis by presenting complex market information in a clear, visual format
When to explore it
The indicator works best in markets with clear trending behavior and consistent volume. It is particularly effective for traders focusing on short-term price movements like scalping and day trading. Optimal use includes combining the indicator with other technical analysis tools such as moving averages, RSI, and candlestick patterns.
Traders should pay special attention to breakouts confirmed by high volume and multiple timeframe analysis. The indicator is most reliable in liquid markets with regular trading activity. It performs well across different asset classes including stocks, forex, and cryptocurrencies
Keep exploring
What we’ve verified
Access, alerts and repainting behaviour have not been independently verified for this indicator. Check the creator’s current publication and settings.
General descriptions and classifications are recovered research. Verified details above identify the specific checks we have completed. Check the creator’s current publication for later changes.