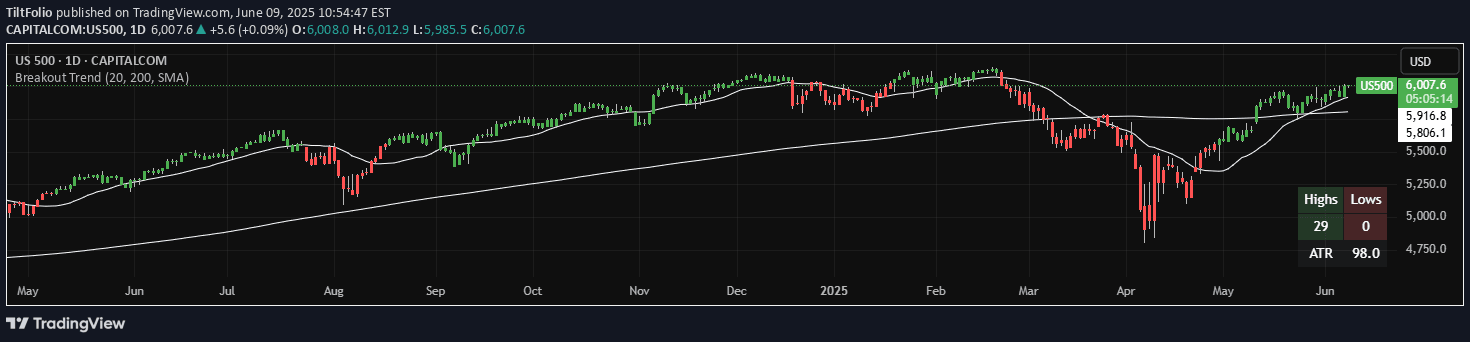
The Swing Harmony Indicator calculates average price levels using highest high, lowest low, and moving average to provide dynamic trend insights across different market conditions.
Explore complementary indicator rolesHow it works
The Swing Harmony Indicator operates by first calculating the average of the highest high and lowest low prices over a specified time period. It simultaneously computes a simple moving average of the closing prices to create multiple reference points for market analysis.
As these averages are plotted on the chart, the indicator dynamically changes the color of the average line based on the relationship between the two calculated averages. This color-coding provides traders with an immediate visual representation of potential trend shifts and price momentum.
Why it may be useful
The Swing Harmony Indicator offers traders a comprehensive view of market dynamics by combining multiple price calculation methods into a single, intuitive visualization. By integrating highest high, lowest low, and moving average calculations, it provides a more nuanced perspective on potential trend movements than single-metric indicators.
Its dynamic color-coding feature allows traders to quickly interpret market conditions, highlighting potential trend changes and providing rapid insights into price momentum. This multi-layered approach helps traders make more informed decisions by presenting a holistic view of price action.
When to explore it
The Swing Harmony Indicator is most effective in markets with clear trending characteristics, where price movements show consistent directional momentum. It performs exceptionally well in markets experiencing moderate volatility, where price ranges are neither too compressed nor extremely wide.
Traders should consider using this indicator during periods of stable market conditions, such as during established trend phases in stocks, forex, or commodities. It is particularly useful for day and swing traders seeking to identify potential trend reversals and confirm ongoing market momentum.
Keep exploring
What we’ve verified
Access, alerts and repainting behaviour have not been independently verified for this indicator. Check the creator’s current publication and settings.
General descriptions and classifications are recovered research. Verified details above identify the specific checks we have completed. Check the creator’s current publication for later changes.