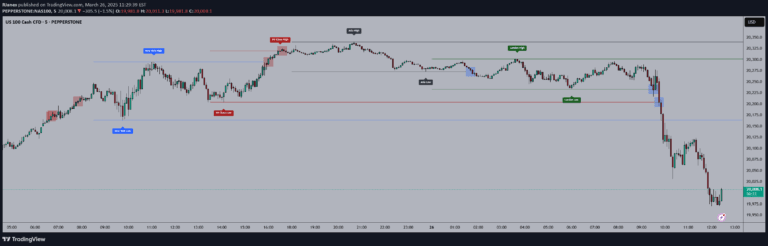
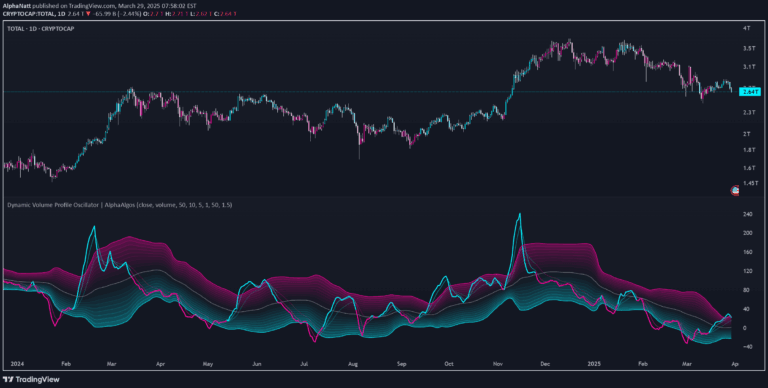
A multi-layered trend detection tool for intraday traders that combines TEMA cloud, session sweeps, and volume analysis to identify high-probability market reversals and continuations.
Explore complementary indicator rolesHow it works
The indicator uses a multi-layered TEMA cloud with 9, 20, 34, and 50 periods to establish trend structure. It dynamically labels bullish and bearish trends when the trend flips. The centerline of the TEMA 20 helps visualize core trend direction.
It detects session-based liquidity sweeps across different market sessions like Asia, London, and New York. Volume and absorption dots highlight hidden market pressure. The tool also identifies swing highs and lows, both external and internal, to provide additional trend confirmation signals
Why it may be useful
This indicator is crucial for traders seeking precision in market entry and exit points. By integrating multiple technical analysis components, it provides a comprehensive view of market dynamics. The TEMA cloud offers clear trend visualization, while session sweeps and volume analysis help traders understand underlying market sentiment.
It reduces guesswork by providing objective markers for trend changes, liquidity zones, and potential reversal points. The tool's multi-layered approach increases the probability of successful trades by combining different technical signals
When to explore it
The indicator works best during active trading sessions with high liquidity, particularly during London and New York market hours. It is most effective for traders seeking short-term opportunities in volatile markets.
Scalpers and day traders will find it especially useful for quick decision-making. The tool is ideal when looking to confirm trend directions, anticipate pullbacks, and identify volume-backed reversals. Traders should use it in conjunction with other confirmatory indicators for best results
Keep exploring
What we’ve verified
Access, alerts and repainting behaviour have not been independently verified for this indicator. Check the creator’s current publication and settings.
General descriptions and classifications are recovered research. Verified details above identify the specific checks we have completed. Check the creator’s current publication for later changes.