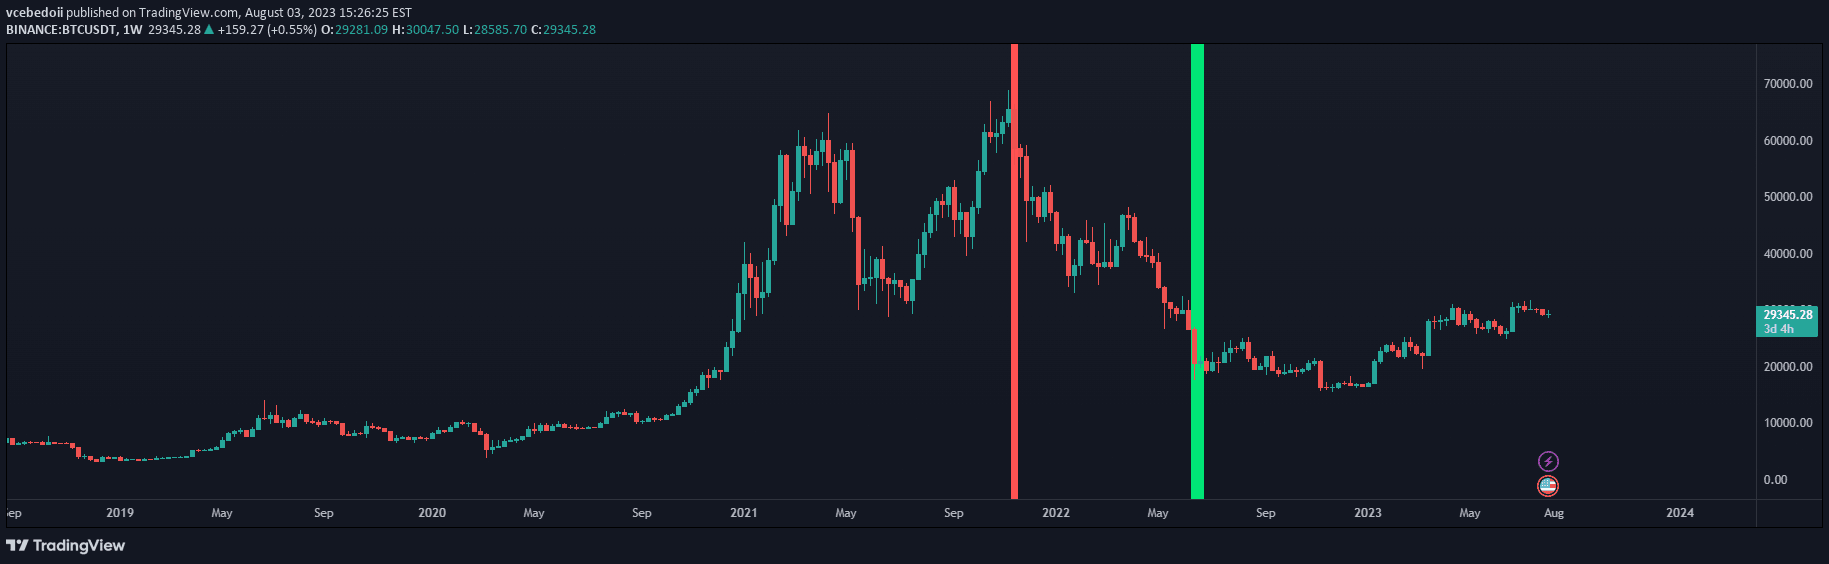
A multi-indicator trend confirmation signal combining PSAR, MACD, stochastic oscillator, and awesome oscillator to generate precise buy and sell trading signals.
Explore complementary indicator rolesHow it works
The indicator generates trading signals by analyzing multiple technical indicators simultaneously. It first tracks the parabolic SAR (PSAR) to determine the underlying trend direction, providing visual points on the chart. Then, it evaluates three additional momentum indicators: MACD, stochastic oscillator, and awesome oscillator to confirm potential trend changes.
For a sell signal, the indicator requires specific conditions: the MACD line must cross below the signal line, the stochastic %K line must cross above the %D line, and the last awesome oscillator column must be red. Conversely, a buy signal occurs when the MACD line crosses above the signal line, the stochastic %K line crosses below the %D line, and the last awesome oscillator column is green.
Why it may be useful
Multi-indicator signals provide traders with more robust and reliable trading decisions by reducing false signals and increasing confirmation probability. By combining different technical indicators, the signal mitigates individual indicator limitations and offers a more comprehensive market analysis approach.
The integrated approach allows traders to validate potential trend reversals through multiple technical perspectives. This method helps minimize emotional trading decisions, provides a systematic entry and exit strategy, and enhances overall trading discipline by requiring multiple technical conditions to be met before generating a signal.
When to explore it
This indicator performs most effectively in higher timeframes, where market noise is reduced and trends are more clearly defined. It is particularly useful in markets with moderate to strong trending characteristics, such as forex, stocks, and commodities with consistent directional movements.
Traders should apply this signal during periods of stable market conditions and avoid using it during extreme volatility or news-driven market events. It works best when combined with additional risk management strategies, such as proper position sizing, stop-loss placement, and understanding the broader market context.
Keep exploring
What we’ve verified
Access, alerts and repainting behaviour have not been independently verified for this indicator. Check the creator’s current publication and settings.
General descriptions and classifications are recovered research. Verified details above identify the specific checks we have completed. Check the creator’s current publication for later changes.