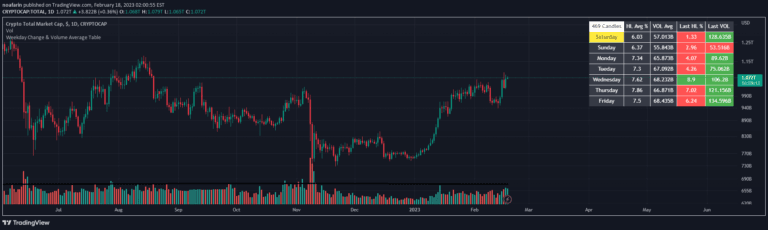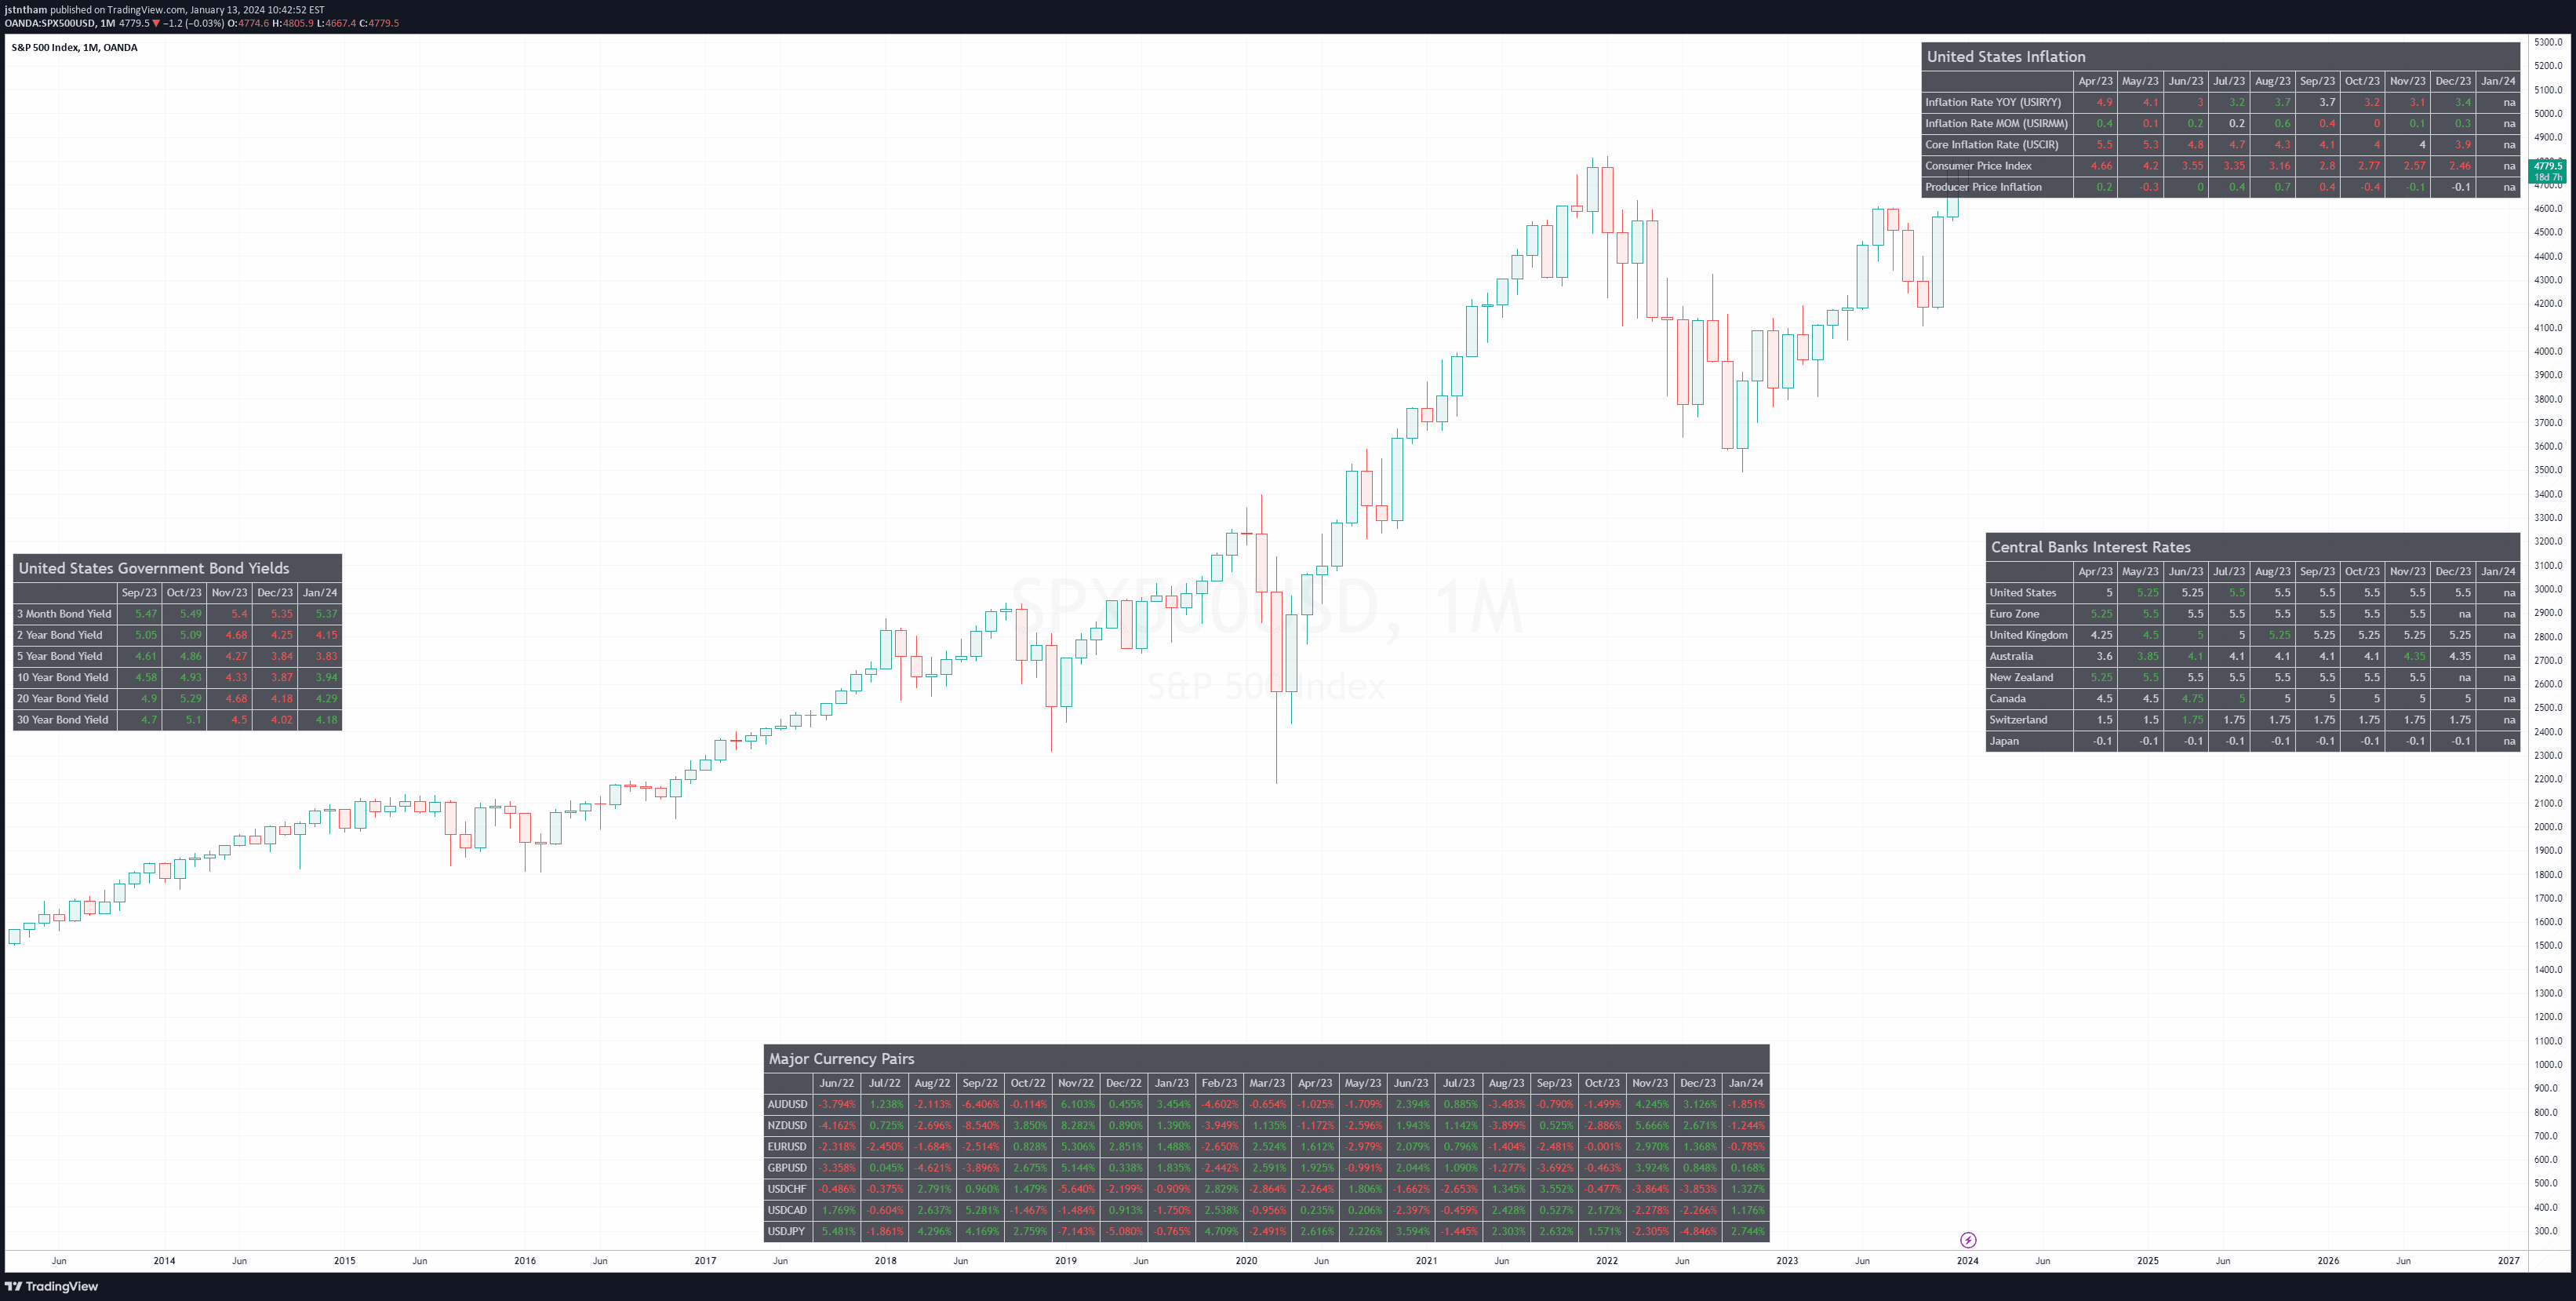
A statistical tool for tracking multiple financial symbols, displaying historical data points with color-coded value changes and formatting options for enhanced visual analysis.
Explore complementary indicator rolesHow it works
The signal creates a comprehensive tabular display of financial data across multiple symbols, allowing traders to visualize performance metrics dynamically. Users can select up to 10 unique symbols and track up to 20 historical data points, providing a flexible and customizable analytical framework.
The system incorporates advanced visual formatting techniques, including color-coded indicators that highlight value increases and decreases. Traders can customize display settings, such as percentage formatting and color schemes, to enhance data interpretation and quickly identify market trends and shifts.
Why it may be useful
This multi-symbol statistical tool provides traders with a consolidated view of market performance, enabling rapid comparative analysis across different financial instruments. By presenting data in an intuitive, color-coded format, traders can quickly assess relative performance and identify potential trading opportunities.
The flexible display mechanism allows for real-time insights, supporting decision-making across various trading strategies. Its adaptability makes it valuable for traders seeking comprehensive market overviews, helping to streamline complex financial information into easily digestible visual representations.
When to explore it
This signal is most effective during periods of market volatility when traders need to monitor multiple symbols simultaneously and track rapid performance changes. It is particularly useful for comparing different financial instruments across various timeframes, from short-term scalping to longer-term swing trading strategies.
Traders can leverage this tool during market transitions, sector rotations, or when evaluating relative strength among different assets. Its customizable nature makes it suitable for both technical analysts seeking detailed performance metrics and traders wanting a quick, comprehensive market snapshot.
Keep exploring
What we’ve verified
Access, alerts and repainting behaviour have not been independently verified for this indicator. Check the creator’s current publication and settings.
General descriptions and classifications are recovered research. Verified details above identify the specific checks we have completed. Check the creator’s current publication for later changes.