
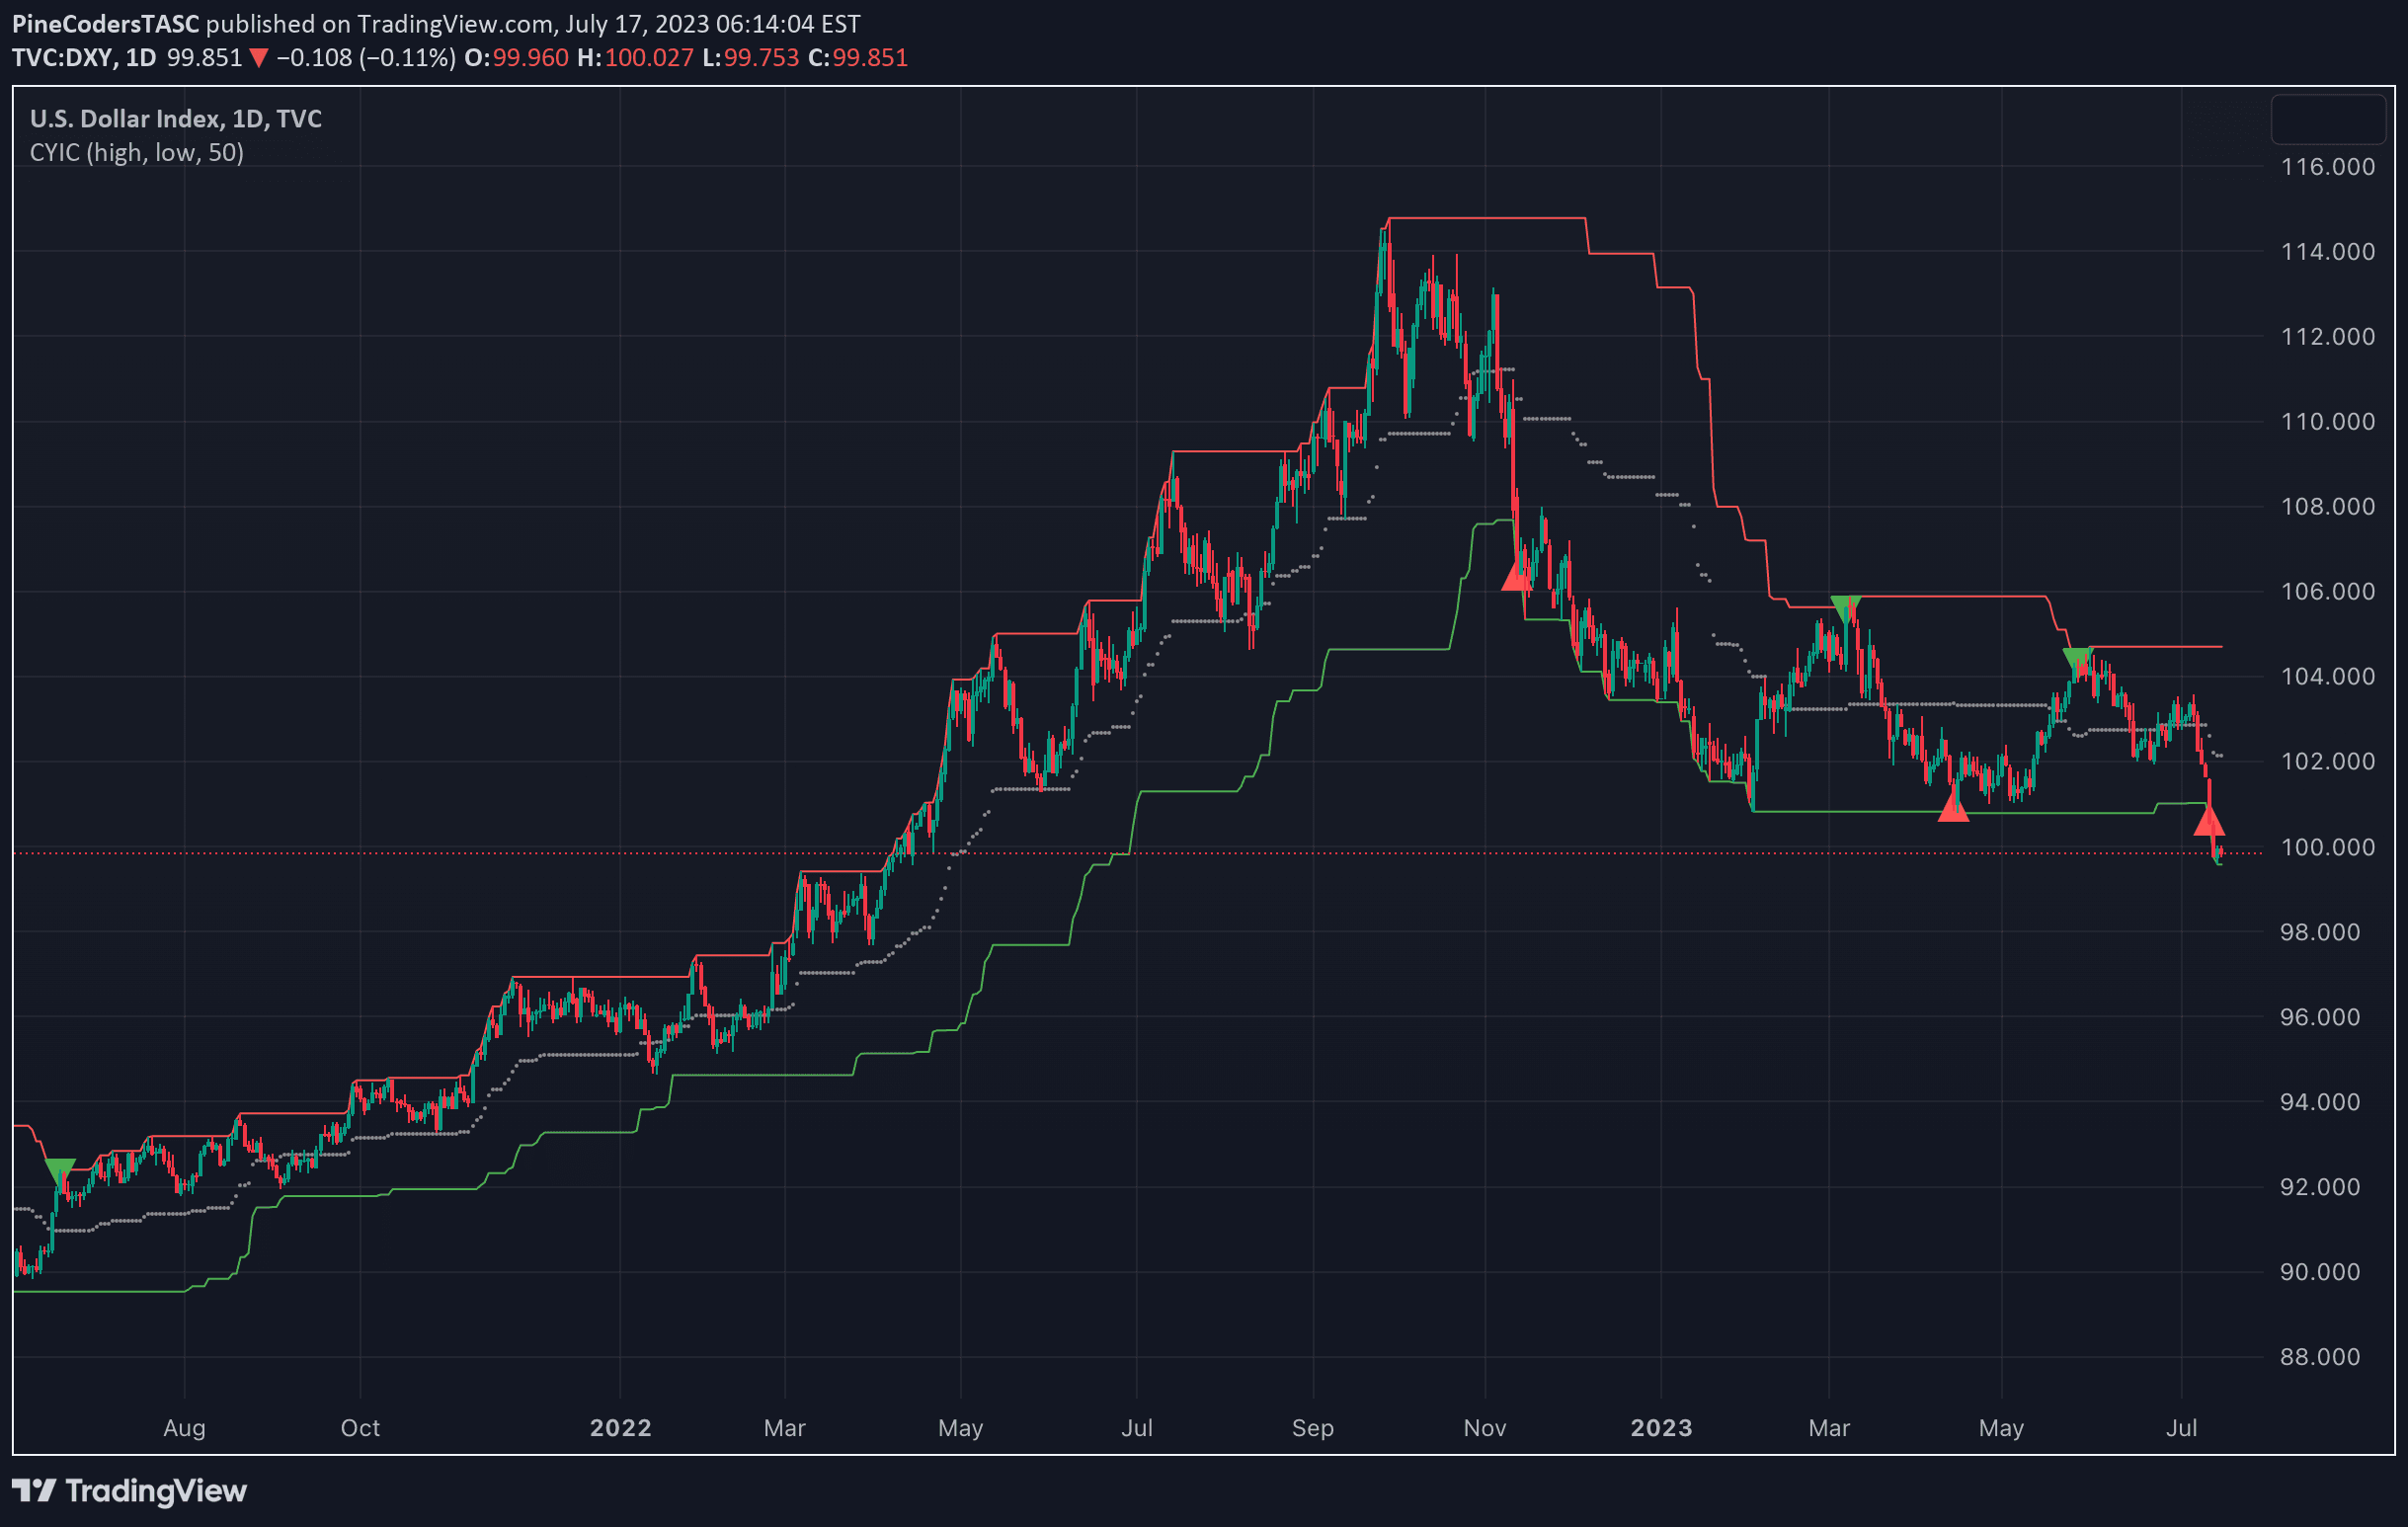
Donchian Channels are price-based technical indicators tracking market trends by plotting highest highs and lowest lows over a specific period, helping traders identify potential trend movements.
Explore complementary indicator rolesHow it works
Donchian Channels operate by calculating three distinct lines: an upper line representing the highest high, a lower line showing the lowest low, and a middle line representing the median over a specified lookback period. Traders monitor these lines to understand price behavior and potential trend dynamics.
When price breaks through the upper channel, it signals potential bullish momentum, while breaking the lower channel suggests bearish pressure. The width of the channel itself provides insights into market volatility, with wider channels indicating more significant price fluctuations and potential trend strength.
Why it may be useful
Donchian Channels offer traders a straightforward visual method to analyze market trends and potential entry or exit points without complex mathematical calculations. They provide clear, objective signals that can help traders make more informed decisions by highlighting key price movement thresholds.
By displaying highest highs and lowest lows, these channels help traders understand market sentiment, identify potential trend reversals, and manage risk more effectively. The simplicity of the indicator makes it accessible to traders of various skill levels, enabling them to quickly interpret market conditions.
When to explore it
Donchian Channels work best in trending markets with clear directional movements, particularly in assets like commodities, futures, and currencies that exhibit strong trending characteristics. Traders should preferably use longer timeframes to reduce false signals and increase reliability of trend identification.
These channels are most effective when combined with other technical indicators to confirm signals and provide additional context. They are particularly useful during periods of sustained market momentum, helping traders capture potential extended price movements and manage their trading strategies more precisely.
Keep exploring
What we’ve verified
Access, alerts and repainting behaviour have not been independently verified for this indicator. Check the creator’s current publication and settings.
General descriptions and classifications are recovered research. Verified details above identify the specific checks we have completed. Check the creator’s current publication for later changes.


