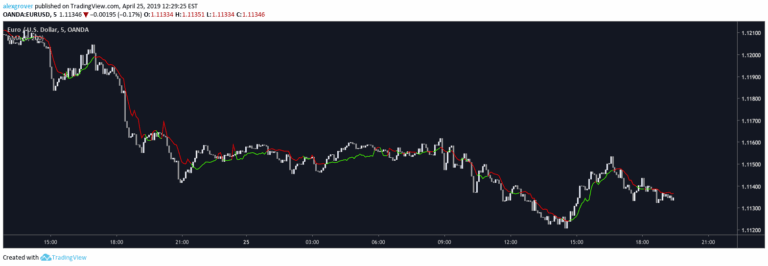
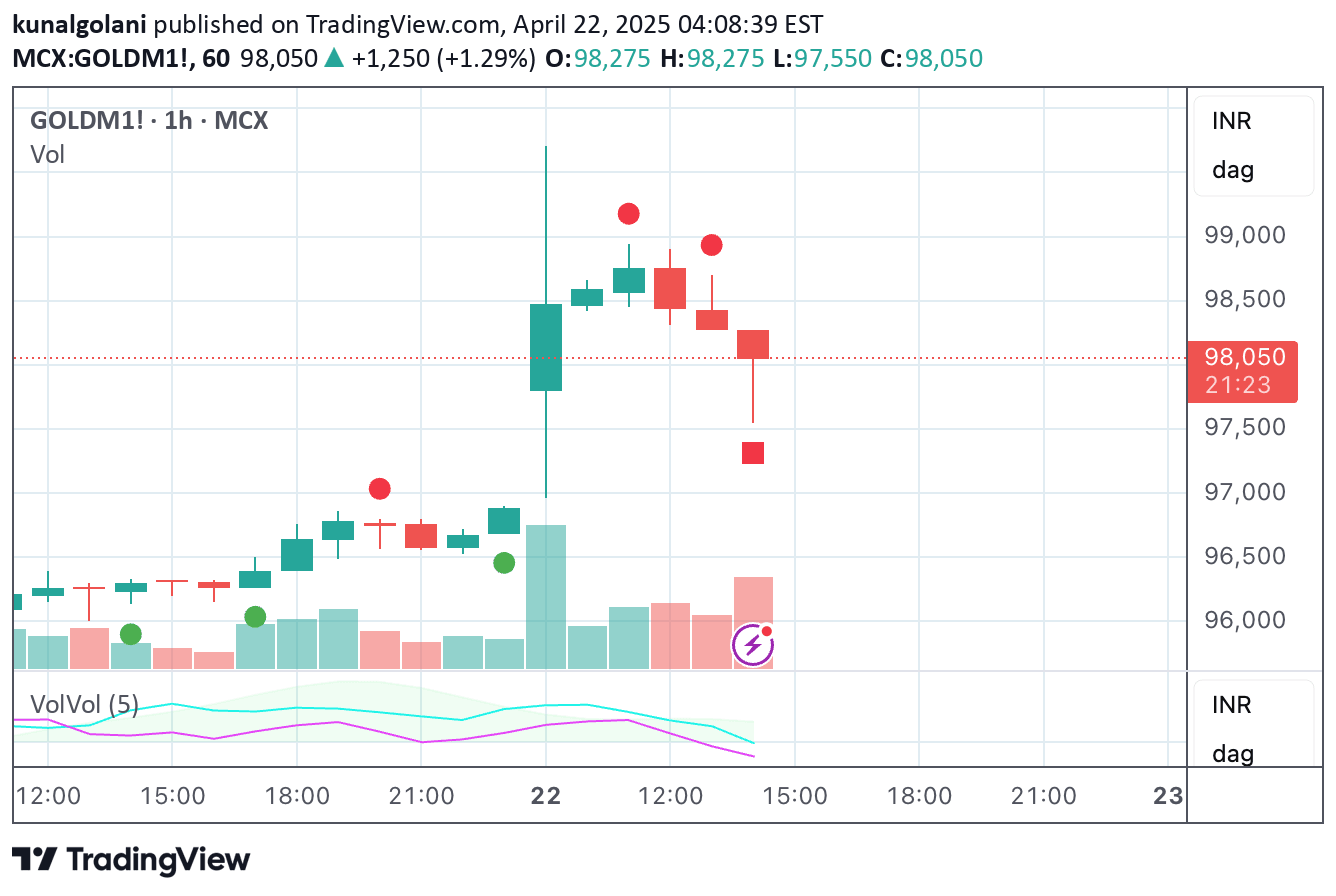
A comprehensive volatility indicator that measures price fluctuations using three different calculation methods and customizable moving average types for detailed market analysis.
Explore complementary indicator rolesHow it works
The Average Volatility indicator calculates volatility through three distinct methods: High to Low, Body, and Shadows. It measures price range variations by comparing different price points within each candle, providing a multi-dimensional view of market movement.
Users can apply five different moving average types (SMA, EMA, SMMA, WMA, VWMA) to these volatility calculations, allowing for flexible and customized analysis. The indicator generates three separate plots in blue, green, and red, representing different volatility perspectives and enabling traders to gain comprehensive insights into market price dynamics.
Why it may be useful
Volatility is crucial for understanding market behavior and potential price movements. This indicator provides traders with a nuanced view of market volatility, helping them assess potential risk and identify trading opportunities across different market conditions.
By offering multiple volatility calculation methods and moving average options, the indicator allows traders to adapt their analysis to specific market scenarios. The comprehensive approach helps traders make more informed decisions by providing a deeper understanding of price fluctuations and potential trend changes.
When to explore it
The Average Volatility indicator is most effective during periods of market uncertainty or when traders need a detailed understanding of price movement dynamics. It works exceptionally well in markets experiencing significant price fluctuations, helping traders identify potential trend changes and assess market volatility.
Traders can utilize this indicator across various timeframes and market types, making it versatile for different trading strategies. It is particularly useful when combined with other technical analysis tools to confirm trading signals and provide additional context for market analysis.
Keep exploring
What we’ve verified
Access, alerts and repainting behaviour have not been independently verified for this indicator. Check the creator’s current publication and settings.
General descriptions and classifications are recovered research. Verified details above identify the specific checks we have completed. Check the creator’s current publication for later changes.