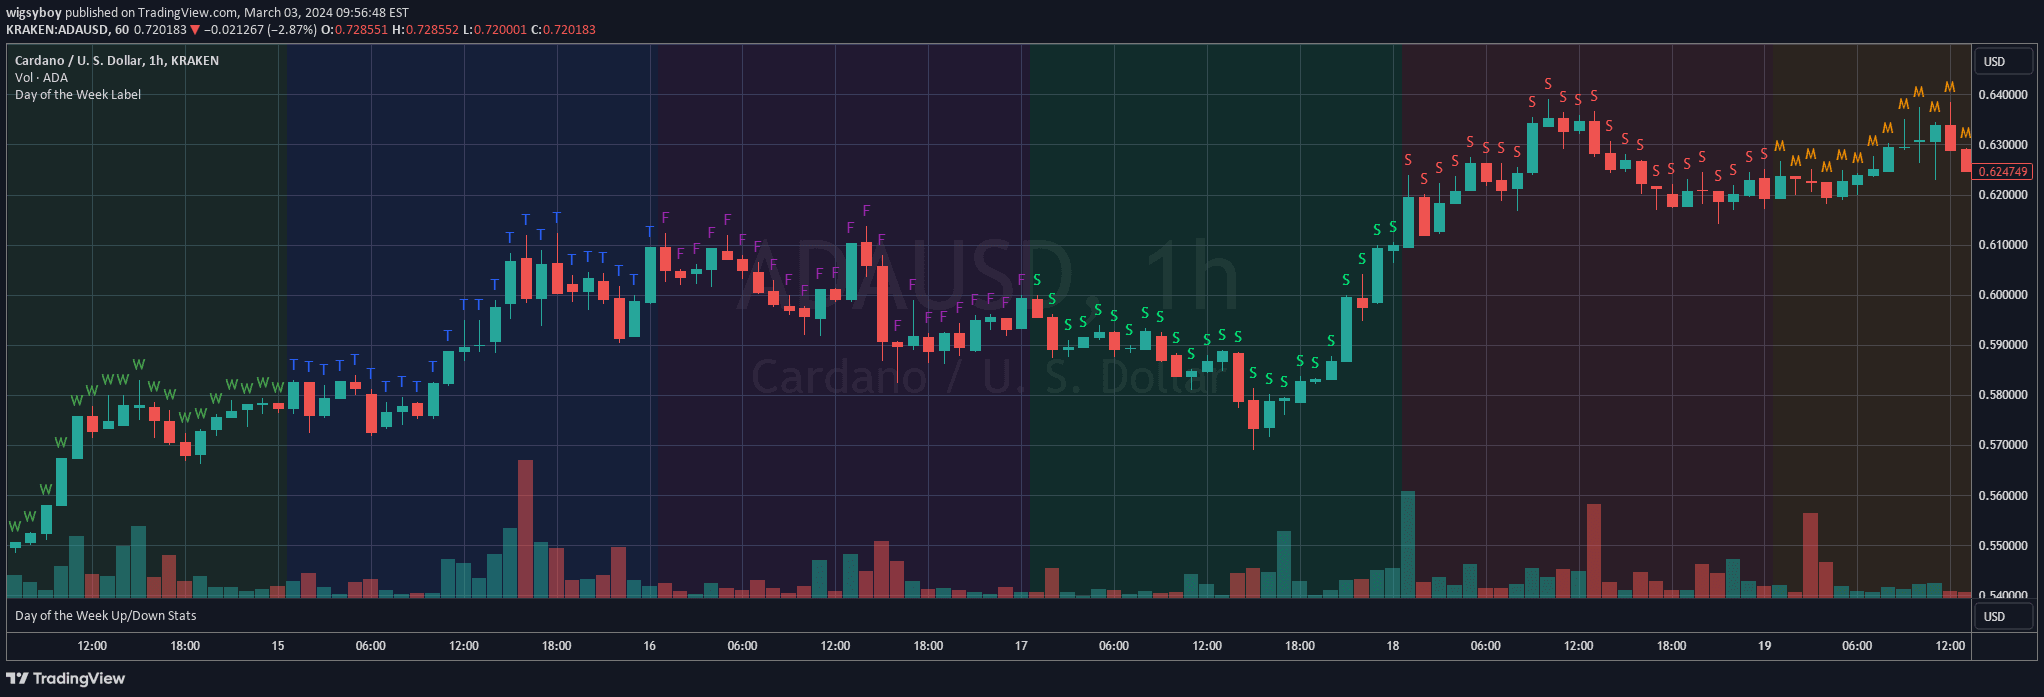
A trend-following strategy that identifies entry points based on consecutive candles with the same sentiment, providing clear buy and sell signals using price action analysis.
Explore complementary indicator rolesHow it works
This trading signal relies on identifying consecutive candles with the same bullish or bearish sentiment, typically requiring three consecutive candles before generating a signal. When three green (bullish) candles appear in sequence, a sell signal is triggered, with the entry line positioned one tick below the open of the previous green candle.
The strategy works best on higher timeframes like 1-hour charts, allowing traders to align entries with the broader market trend. Traders can further refine entries by using moving averages to confirm trend direction, such as only taking signals when price is above or below a 50-period simple moving average.
Why it may be useful
This trading signal provides a structured approach to identifying potential market reversals and trend continuations based on price action patterns. By focusing on consecutive candle formations, traders can develop a disciplined entry strategy that reduces emotional decision-making and provides clear, objective trading criteria.
The method offers flexibility in stop-loss placement, allowing traders to use swing highs/lows, support/resistance levels, or indicators like PSAR for risk management. This adaptability makes the strategy applicable across different markets and trading styles, giving traders a systematic framework for analyzing price movements.
When to explore it
This signal is most effective on higher timeframes like 1-hour or daily charts, where price action patterns are more reliable and less prone to noise. It works particularly well in trending markets where consecutive candles demonstrate clear directional momentum, making it suitable for swing trading strategies.
Traders should preferably use this signal in liquid markets with consistent price movements, such as major forex pairs, stock indices, or highly traded commodities. The strategy is especially useful for traders seeking a systematic, visual approach to market entry that doesn't rely heavily on complex technical indicators.
Keep exploring
What we’ve verified
Access, alerts and repainting behaviour have not been independently verified for this indicator. Check the creator’s current publication and settings.
General descriptions and classifications are recovered research. Verified details above identify the specific checks we have completed. Check the creator’s current publication for later changes.