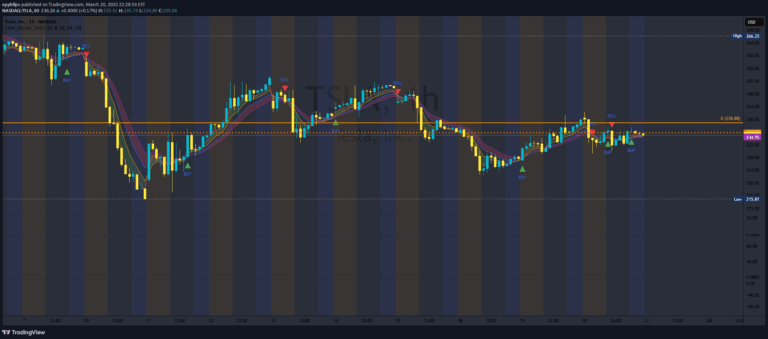
A trading strategy using EMA crossovers with a 50-period EMA filter to generate bullish and bearish signals based on the alignment of shorter-term EMAs.
Explore complementary indicator rolesHow it works
The strategy uses Exponential Moving Averages (EMAs) of 8, 16, and 50 periods to generate trading signals. When the 8-period and 16-period EMAs cross above each other and simultaneously rise above the 50-period EMA, a buy signal is generated. This indicates a potential bullish trend with short-term momentum gaining strength.
Conversely, when the 8-period and 16-period EMAs cross below each other and drop below the 50-period EMA, a sell signal is triggered. The 50-period EMA acts as a trend filter, ensuring that trades are only executed when the overall market trend supports the short-term price movement.
Why it may be useful
This EMA crossover strategy provides traders with a systematic approach to identifying trend changes and potential entry and exit points. By using multiple EMAs with different periods, the strategy helps filter out false signals and provides a more robust trading mechanism. The 50-period EMA serves as a crucial trend confirmation indicator, helping traders avoid trading against the primary market direction.
The method is particularly valuable because it combines multiple moving averages to create a more comprehensive view of market momentum. It helps traders distinguish between temporary price fluctuations and genuine trend reversals, thereby reducing the likelihood of entering trades during choppy or consolidating market conditions.
When to explore it
The EMA crossover strategy works best in trending markets with clear directional movements, particularly in liquid and volatile instruments like Bank Nifty. It is most effective during periods of sustained bullish or bearish trends where short-term momentum aligns with the longer-term market direction.
Traders should pay special attention to this strategy during significant market events or economic announcements that can trigger strong directional moves. However, the strategy may underperform during range-bound or highly unpredictable market conditions where price movements lack clear directional momentum. Traders should combine this signal with other technical and fundamental analysis tools to improve overall trading accuracy and risk management.
Keep exploring
What we’ve verified
Access, alerts and repainting behaviour have not been independently verified for this indicator. Check the creator’s current publication and settings.
General descriptions and classifications are recovered research. Verified details above identify the specific checks we have completed. Check the creator’s current publication for later changes.