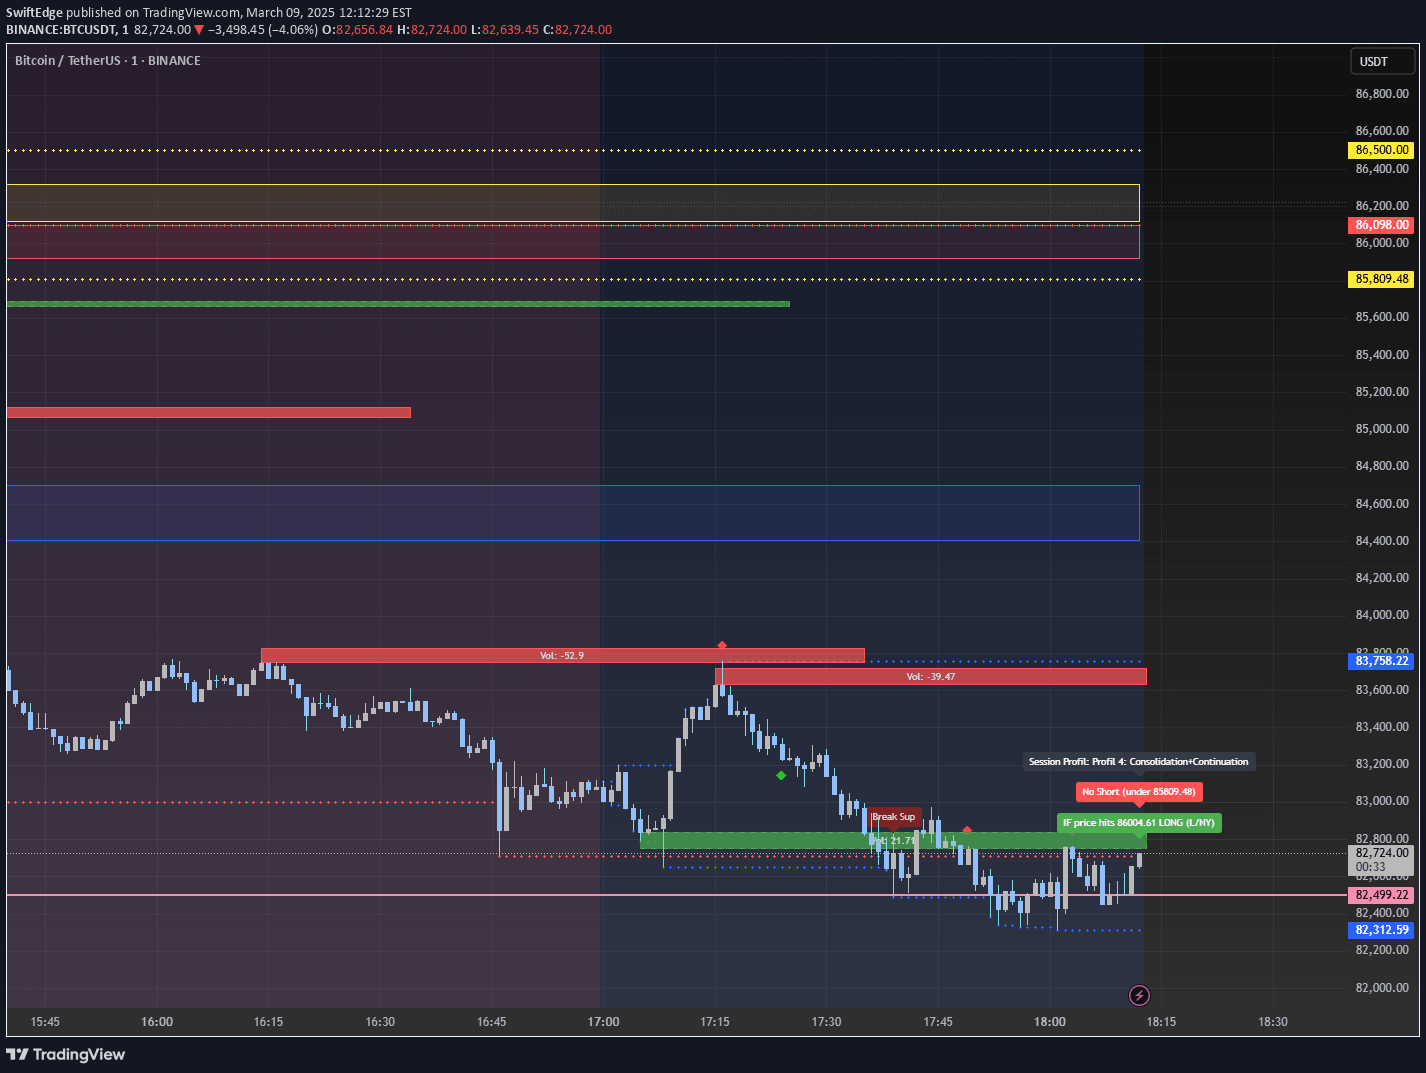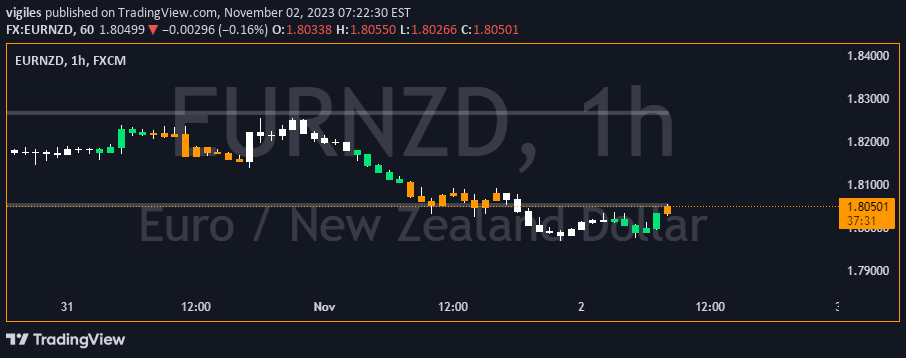
A versatile trading indicator providing session-based color coding, previous week's high/low plotting, and customizable chart background marking for strategic market analysis.
Explore complementary indicator rolesHow it works
The trading signal operates by color-coding price bars according to specific trading sessions like Asia, London, and US, using UTC-4 as a default time reference. Traders can customize session timings to match their specific market needs and geographical preferences.
Additionally, the indicator offers functionality to plot previous weeks' high and low levels directly on the chart, helping traders visualize historical price boundaries and potential support/resistance zones. It also provides options to color the chart background for marking significant time periods, such as news releases or important market events.
Why it may be useful
This trading signal enhances market visualization by providing clear, color-coded insights into different trading sessions, allowing traders to quickly understand market dynamics without cluttering their charts. By differentiating session-based price movements, traders can more easily identify session-specific patterns and trading opportunities.
The ability to mark important time periods and plot historical price levels helps traders make more informed decisions by providing contextual information directly on their charts. This reduces the need for multiple supplementary indicators and simplifies the analytical process.
When to explore it
The trading signal is most effective for day traders and scalpers who need to quickly understand session-based market behavior and identify potential trading opportunities within specific timeframes. It works particularly well for traders operating across multiple global markets or those who want to understand inter-session price dynamics.
Traders can leverage this indicator during volatile market periods, news releases, or when analyzing historical price behavior across different trading sessions. It is especially useful for those who want a clean, informative chart that provides multiple layers of market information without excessive visual complexity.
Keep exploring
What we’ve verified
Access, alerts and repainting behaviour have not been independently verified for this indicator. Check the creator’s current publication and settings.
General descriptions and classifications are recovered research. Verified details above identify the specific checks we have completed. Check the creator’s current publication for later changes.