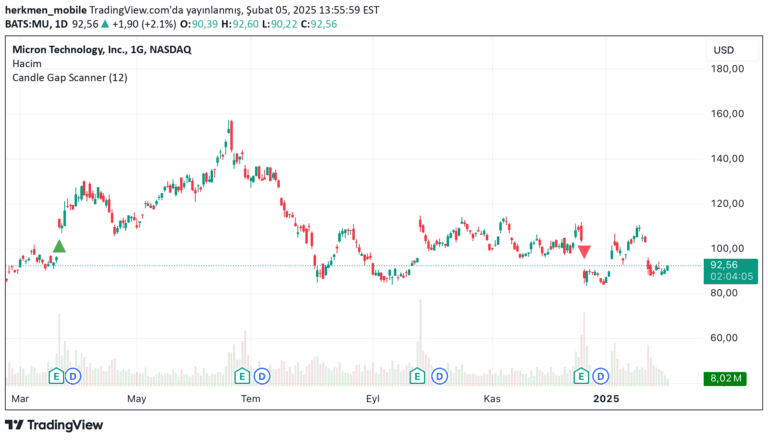
A candlestick analysis tool that tracks bar status across multiple timeframes, identifying specific price action patterns and potential trend reversals through detailed candle state recognition.
Explore complementary indicator rolesHow it works
The Bar Status indicator analyzes candlestick patterns by comparing current and previous bar characteristics to determine specific market conditions. It categorizes bars into different states such as Open Candle (OC), False Break (FB), Break Out (BO), Inside Bar (IN), and False Break Reversal (FBR), with distinct criteria for both green and red candles.
By examining specific parameters like candle close prices, highs, and lows relative to previous bars, the indicator provides a nuanced view of price action. It tracks the current open candle and the last three closed candles, offering traders a comprehensive understanding of recent market movements and potential trend dynamics.
Why it may be useful
The Bar Status indicator helps traders identify subtle price action signals that might indicate potential trend reversals or continuation patterns. By breaking down complex candlestick interactions into clear, recognizable states, it provides traders with a systematic approach to understanding market psychology and momentum.
This granular analysis allows traders to make more informed decisions by revealing hidden market dynamics that might not be immediately apparent through standard price charts. It transforms complex price movements into digestible information, enabling traders to spot potential entry and exit points with greater precision.
When to explore it
The Bar Status indicator is most effective in volatile markets with clear directional movements, particularly during active trading sessions with significant price action. It works best on shorter timeframes like 5-minute, 15-minute, and 1-hour charts where price movements are more dynamic and frequent.
Traders should use this indicator in conjunction with other technical analysis tools to confirm signals and reduce false positives. It is particularly useful for scalpers and day traders who rely on quick, precise market readings and need to make rapid trading decisions based on immediate price action patterns.
Keep exploring
What we’ve verified
Access, alerts and repainting behaviour have not been independently verified for this indicator. Check the creator’s current publication and settings.
General descriptions and classifications are recovered research. Verified details above identify the specific checks we have completed. Check the creator’s current publication for later changes.