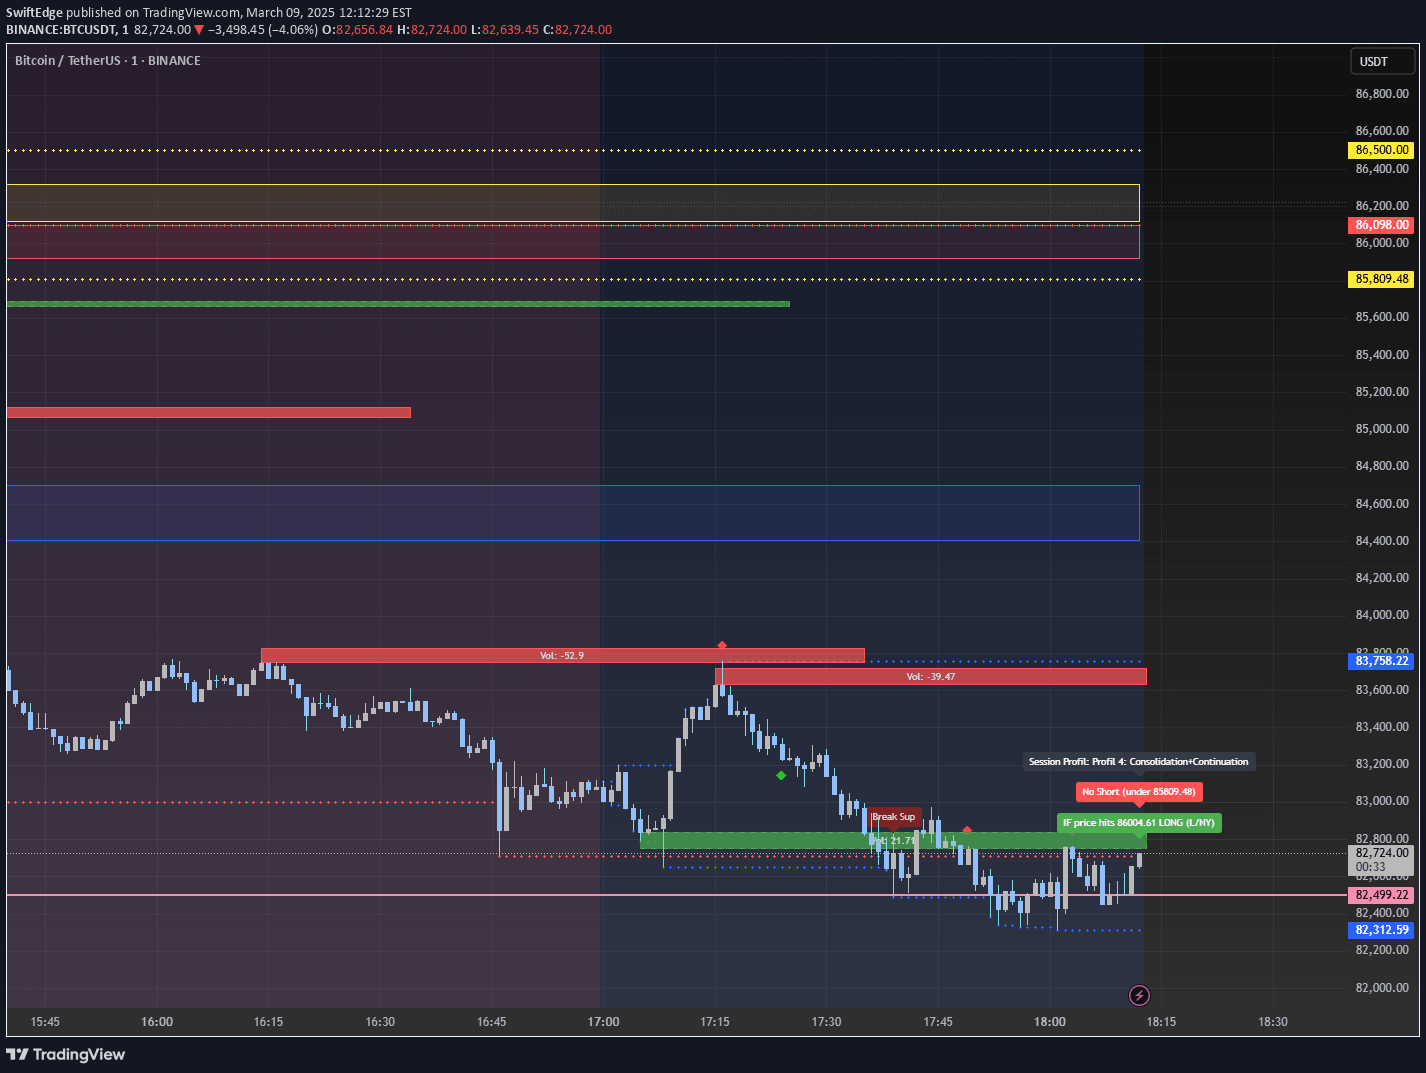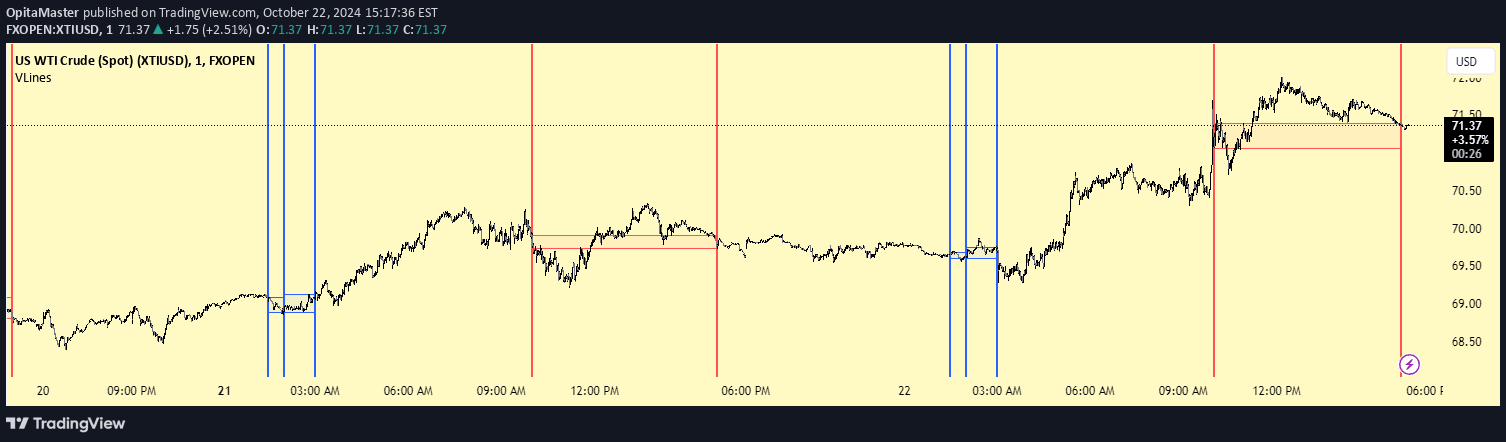
A PineScript indicator creating customizable vertical time lines with zones to mark trading sessions, key market times, and time-based analysis across different market segments.
Explore complementary indicator rolesHow it works
The VLines indicator generates five configurable vertical time lines across the trading chart, allowing precise demarcation of specific time periods. Users can set exact hours and minutes for each line, with options to customize color, visibility, and time zone offsets.
Each line can be independently configured, with three distinct zones created between the lines that feature background shading, horizontal high/low lines, and individual styling controls. The indicator automatically tracks and marks price ranges within these predefined time segments, providing traders with a visual framework for analyzing market behavior.
Why it may be useful
Time-based analysis is crucial for understanding market dynamics, and this indicator provides traders with a flexible tool to segment and analyze price action during specific periods. By creating customizable zones, traders can identify session-specific patterns, track performance during different market hours, and develop more targeted trading strategies.
The visual representation helps traders quickly recognize potential support/resistance levels, session transitions, and price behavior within defined time windows. Its adaptability allows for personalized configuration across various trading styles and market instruments.
When to explore it
This indicator is most effective for traders who need to analyze market behavior during specific time periods, such as pre-market, market, and post-market sessions. It provides particular value for traders focusing on intraday price movements and session-based trading strategies.
Optimal use cases include identifying time-based support/resistance levels, monitoring price ranges during specific trading windows, and creating visual frameworks for understanding market transitions. Traders can leverage this tool across different markets and timeframes to enhance their technical analysis and trading decision-making process.
Keep exploring
What we’ve verified
Access, alerts and repainting behaviour have not been independently verified for this indicator. Check the creator’s current publication and settings.
General descriptions and classifications are recovered research. Verified details above identify the specific checks we have completed. Check the creator’s current publication for later changes.