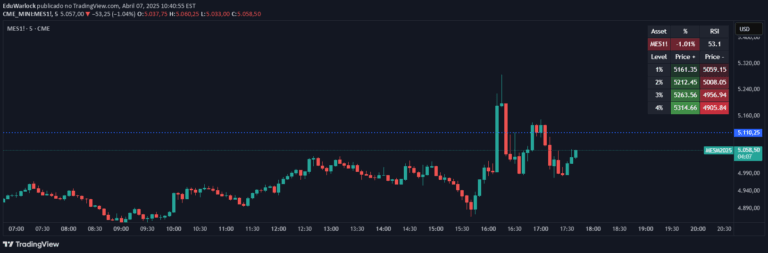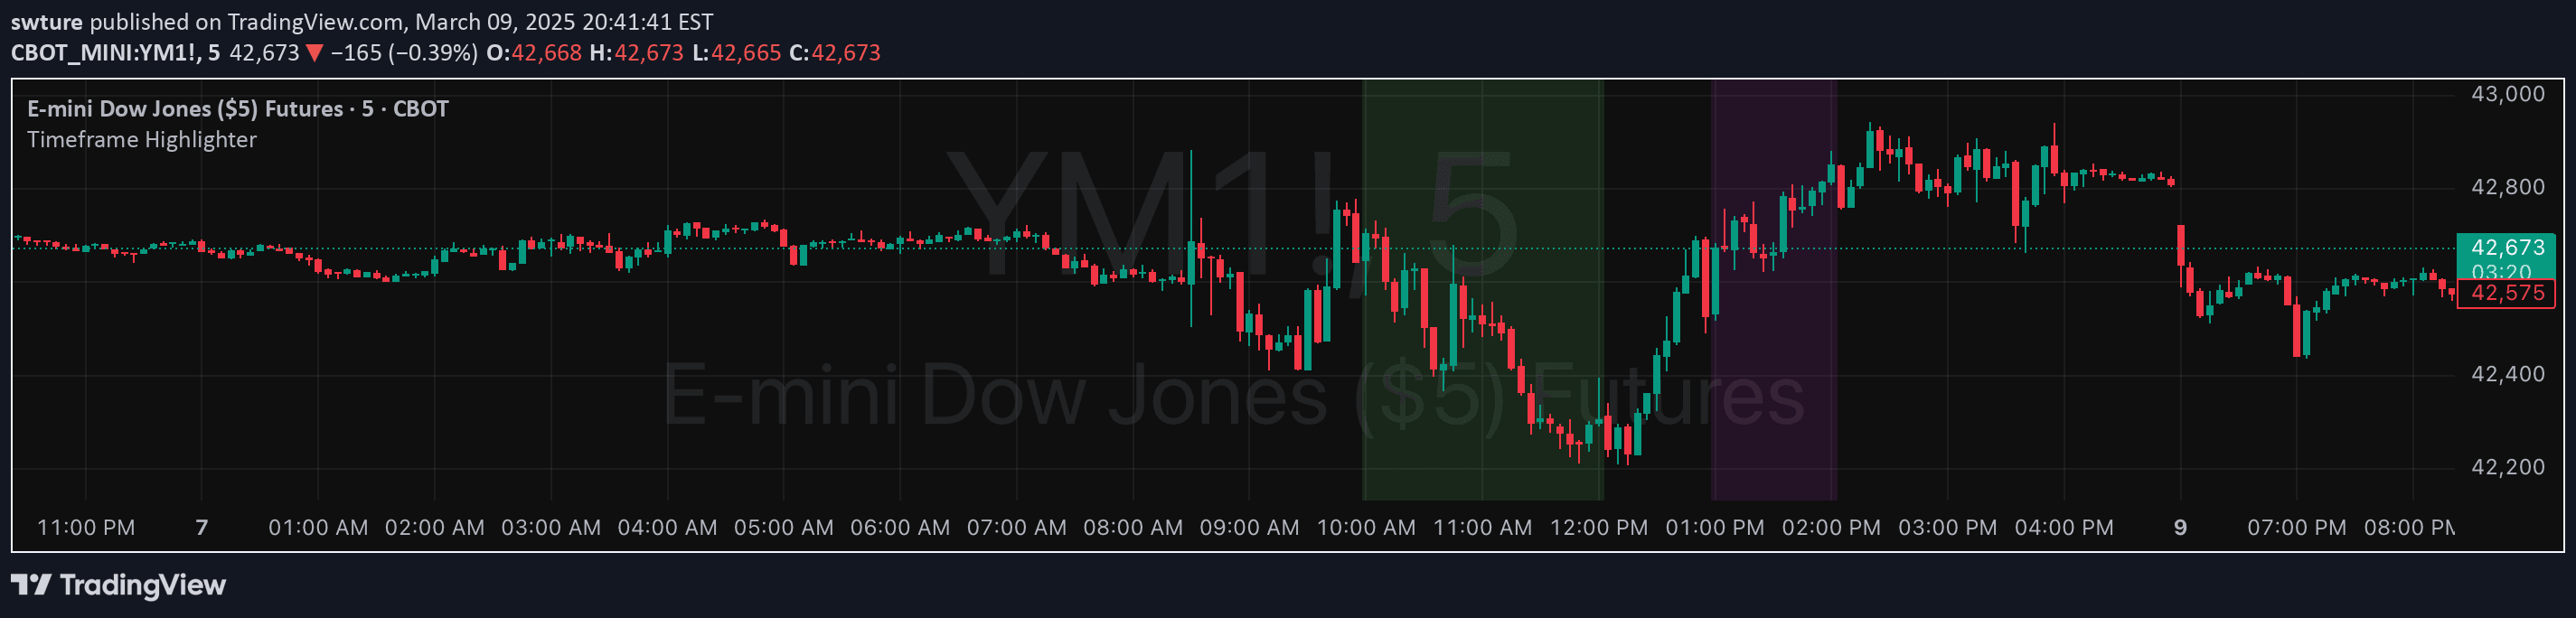
A customizable chart tool that allows traders to highlight specific timeframes across different symbols with color-coded markers for enhanced visual analysis and trading strategy.
Explore complementary indicator rolesHow it works
The timeframe highlight indicator operates by enabling traders to select specific time periods on their trading charts with custom color settings. Users can apply these highlights to individual symbols or across multiple instruments, providing a flexible visual overlay that helps identify and track important market periods.
The tool functions by allowing traders to input precise time ranges based on the EST time zone. When activated, it generates colored overlays or markers on the chart to demarcate selected timeframes, making it easy to quickly identify and reference specific trading windows or historical market conditions.
Why it may be useful
Timeframe highlights provide traders with a powerful visual tool to quickly identify and analyze critical market periods without complex calculations or technical analysis. By allowing customizable color-coded markers, traders can instantly recognize key time ranges that might correspond to significant market events, potential trading opportunities, or historical price patterns.
The flexibility of applying highlights across different symbols enables traders to maintain consistent visual tracking and comparative analysis across multiple instruments. This approach helps traders develop a more comprehensive understanding of market dynamics and potential trading strategies by making time-based information immediately apparent and easily distinguishable.
When to explore it
Traders can utilize timeframe highlights during market analysis, strategy development, and real-time trading scenarios where visual demarcation of specific time periods is crucial. These highlights are particularly useful when studying historical price movements, identifying recurring market patterns, or tracking specific trading sessions across different financial instruments.
The indicator becomes especially valuable during complex market conditions, such as analyzing volatility during economic announcements, comparing performance across different trading sessions, or developing and backtesting trading strategies that rely on specific time-based observations. By providing an intuitive visual tool, traders can quickly segment and analyze market data with enhanced clarity and precision.
Keep exploring
What we’ve verified
Access, alerts and repainting behaviour have not been independently verified for this indicator. Check the creator’s current publication and settings.
General descriptions and classifications are recovered research. Verified details above identify the specific checks we have completed. Check the creator’s current publication for later changes.