
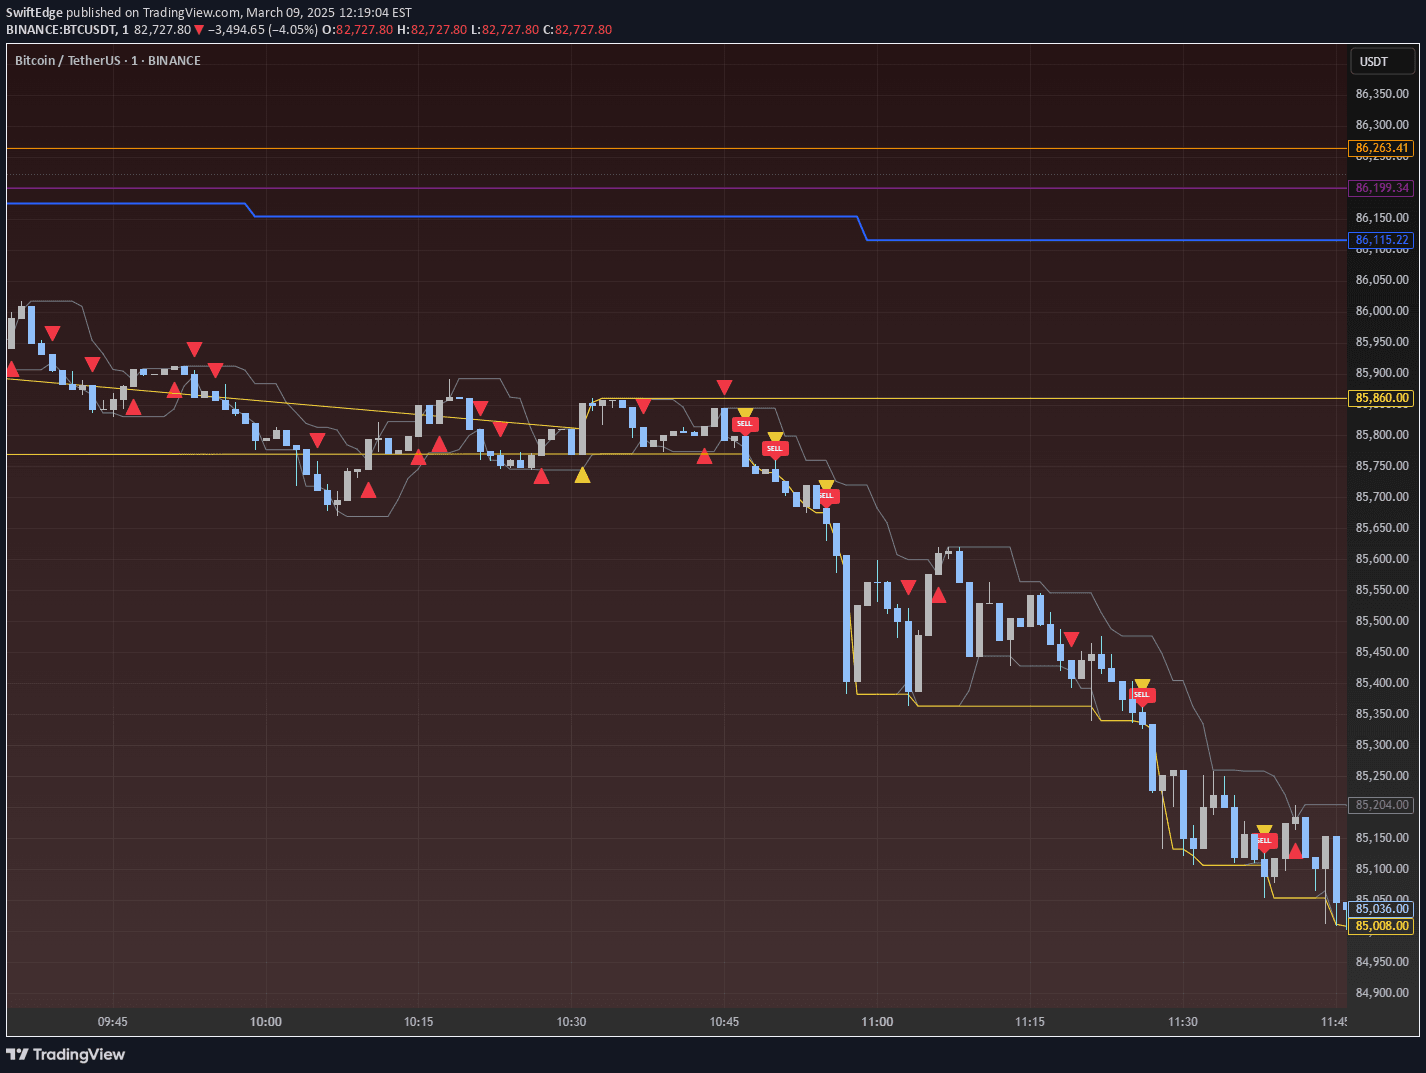
An intraday trading tool that combines Smart Money concepts like order blocks, fair value gaps, and liquidity sweeps to identify high-probability trade opportunities during US market hours.
Explore complementary indicator rolesHow it works
The TJR SEEK AND DESTROY tool analyzes multiple market dynamics simultaneously, starting with order block identification. It marks high-volume, low-range zones as potential reversal points, while tracking fair value gaps to spot price imbalances between previous close and current open.
The system then integrates break of structure (BOS) and liquidity sweep analysis to detect momentum and potential trend shifts. It uses a 1-hour moving average to establish daily market bias, creating a comprehensive framework that filters trades based on structural breaks, volume characteristics, and overall market direction.
Why it may be useful
Traders benefit from this tool's sophisticated approach to identifying high-probability trade setups by combining multiple analytical techniques into a single, cohesive strategy. It reduces market noise by requiring multiple confirmations before generating buy or sell signals, which helps traders make more informed decisions.
The tool's integration of institutional trading concepts like order blocks and liquidity sweeps provides insights into potential market movements that individual traders might otherwise miss. By aligning various technical indicators and market structure elements, it offers a more nuanced approach to intraday trading than traditional single-indicator strategies.
When to explore it
The TJR SEEK AND DESTROY tool is most effective during US market hours, particularly for volatile instruments like SPY, ES futures, and certain forex pairs. It works best on 1-minute to 15-minute charts, where intraday price movements are most pronounced and actionable.
Traders should apply this tool when seeking precise entry and exit points within a single trading session, with a focus on understanding market structure and institutional trading patterns. It is particularly useful for traders who want a systematic approach to identifying potential trade opportunities based on multiple technical and structural indicators.
Keep exploring
What we’ve verified
Access, alerts and repainting behaviour have not been independently verified for this indicator. Check the creator’s current publication and settings.
General descriptions and classifications are recovered research. Verified details above identify the specific checks we have completed. Check the creator’s current publication for later changes.


