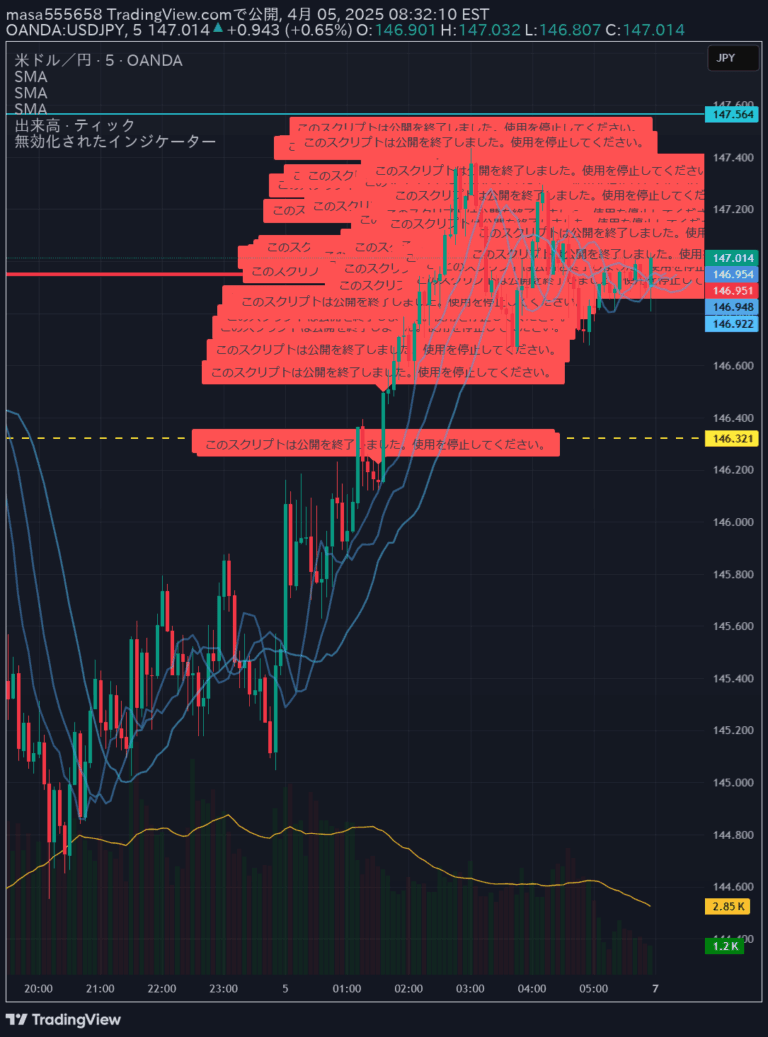
A volume-based trading indicator that tracks buy and sell volume across multiple candles to identify potential market reversals and trend changes using cumulative volume analysis.
Explore complementary indicator rolesHow it works
The indicator calculates cumulative buy and sell volume by tracking price action across candles. It determines buy volume when close price is higher than open price (green candles) and sell volume when open price is higher than close price (red candles).
The algorithm then analyzes these volume relationships over a user-defined lookback period, typically between 10-50 candles. By comparing the highest and lowest volume areas, it generates potential reversal signals, plotting histogram indicators and changing the Simple Moving Average (SMA) color to signify potential market trend changes.
Why it may be useful
This indicator provides traders with a unique perspective on market dynamics by quantifying volume-based trend reversals. It offers a systematic approach to identifying potential entry and exit points by translating complex volume relationships into clear visual signals.
By combining volume analysis with trend identification, traders can make more informed decisions about market direction. The indicator's flexibility in customization and its ability to filter noise through SMA smoothing makes it a valuable tool for understanding underlying market sentiment.
When to explore it
The indicator works best in markets with clear volume trends and during periods of potential trend reversals. It is particularly effective in liquid markets where volume data provides meaningful insights into market psychology and potential directional shifts.
Traders should use this indicator in conjunction with other technical analysis tools, focusing on its signals when the SMA changes color and returns to white. It is most reliable when used on timeframes that capture meaningful volume interactions, such as intraday and short-term trading scenarios.
Keep exploring
What we’ve verified
Access, alerts and repainting behaviour have not been independently verified for this indicator. Check the creator’s current publication and settings.
General descriptions and classifications are recovered research. Verified details above identify the specific checks we have completed. Check the creator’s current publication for later changes.